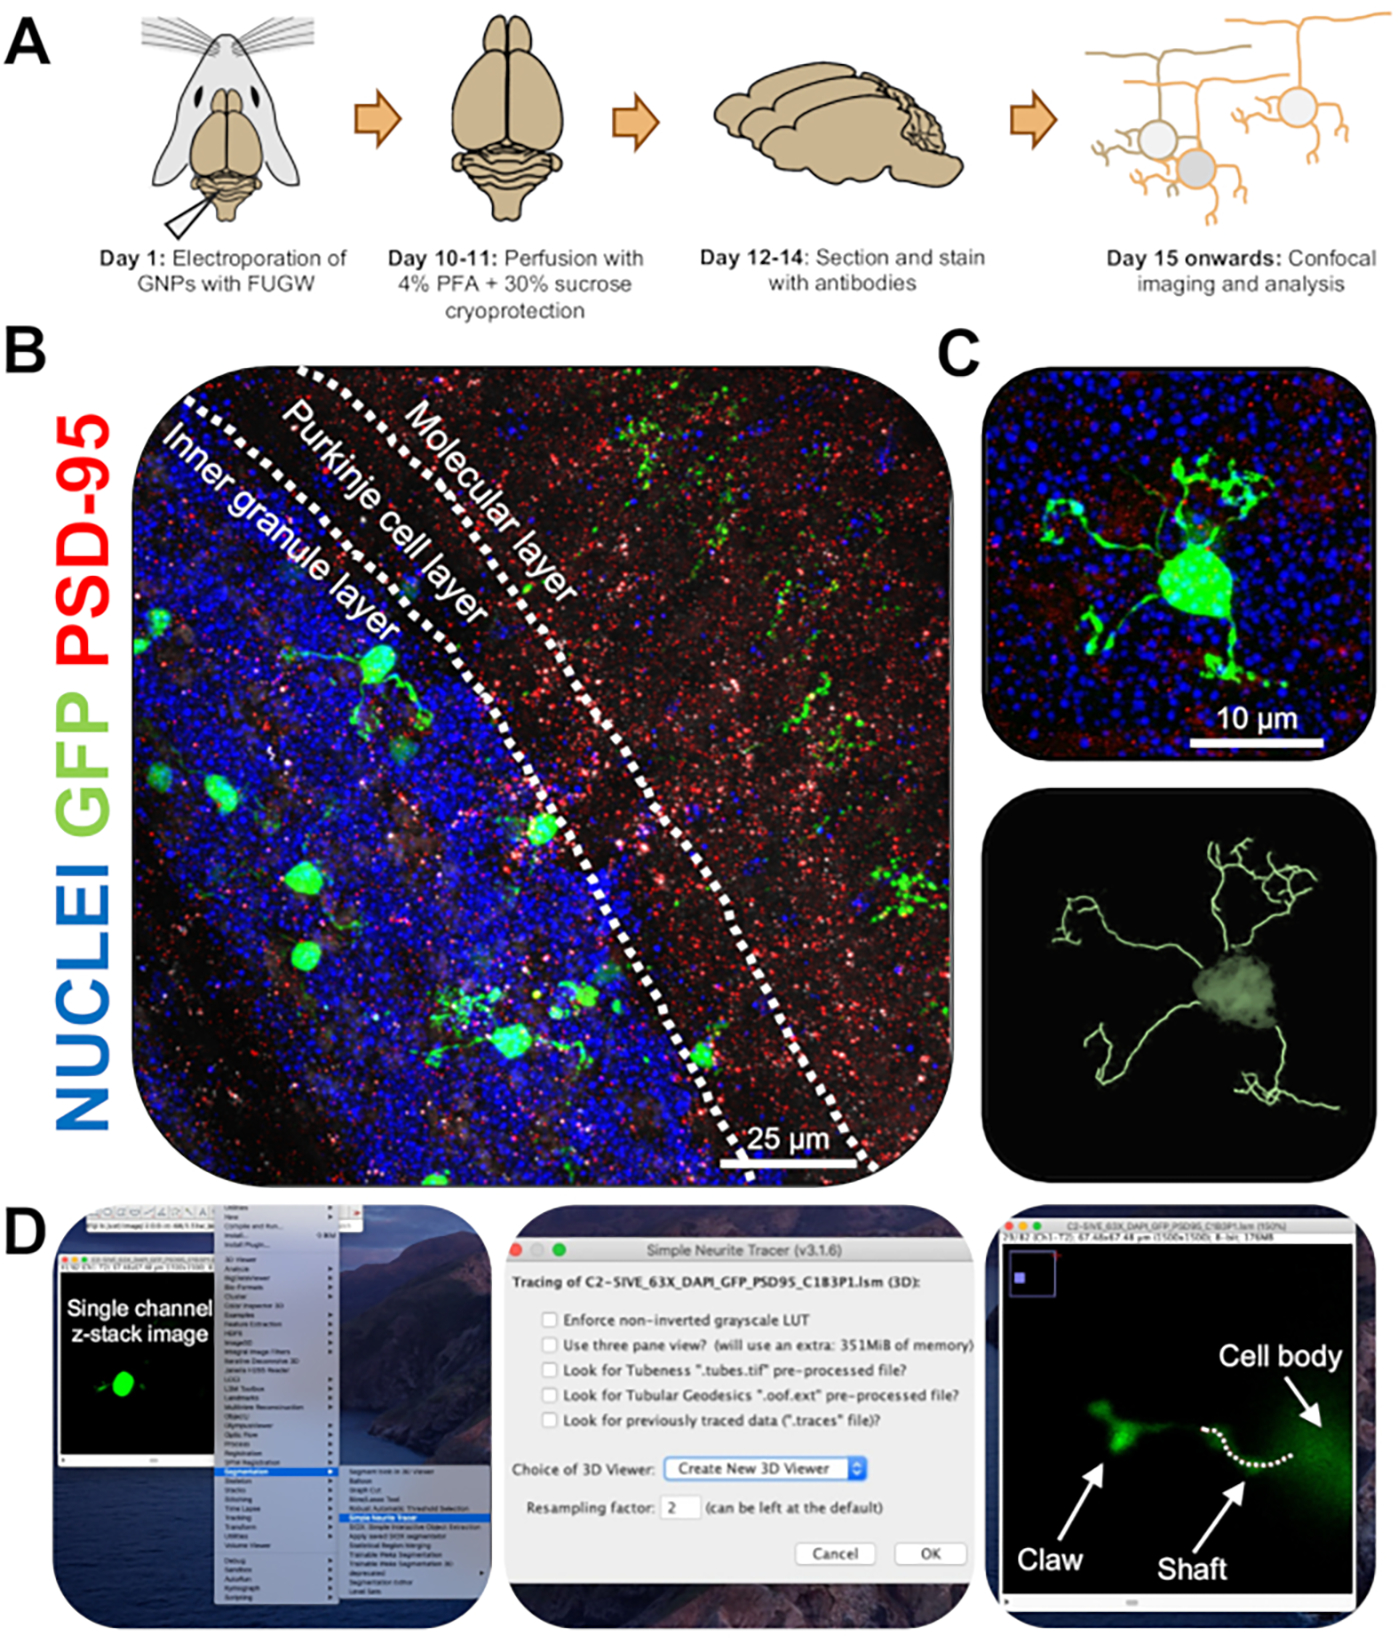
Figure 3: Immunohistochemical analysis and three-dimensional reconstruction of electroporated granule neurons.

P7 CD-1 mice were electroporated with a construct expressing GFP. Brains were collected and subjected to immunohistochemistry, confocal microscopy, and 3D-reconstruction for morphological analysis. (A) Timeline from electroporation to image processing of a 10-DPI mouse. (B) Maximum projection image of a sagittal cross-section of electroporated cerebellum 10-DPI; white lines demarcate cerebellar layers, and scale bar is 25 μm. (C) Maximum projection image of a single electroporated granule neuron 10-DPI and the corresponding 3D trace, scale bar is 10 μm. (D) 3D-reconstructions were generated using the FIJI plugin Simple Neurite Tracer. All measurements were traced through the z-stack, following the cell-fill signal. Shaft and claw measurements were traced separately for every dendrite; dotted line denotes portion of dendrite within the current plane. Abbreviations: 3D = three-dimensional; GFP = green fluorescent protein; DPI = days post-injection; PSD-95 = postsynaptic density protein 95; GNPs = granule neuron progenitors; PFA = paraformaldehyde.
