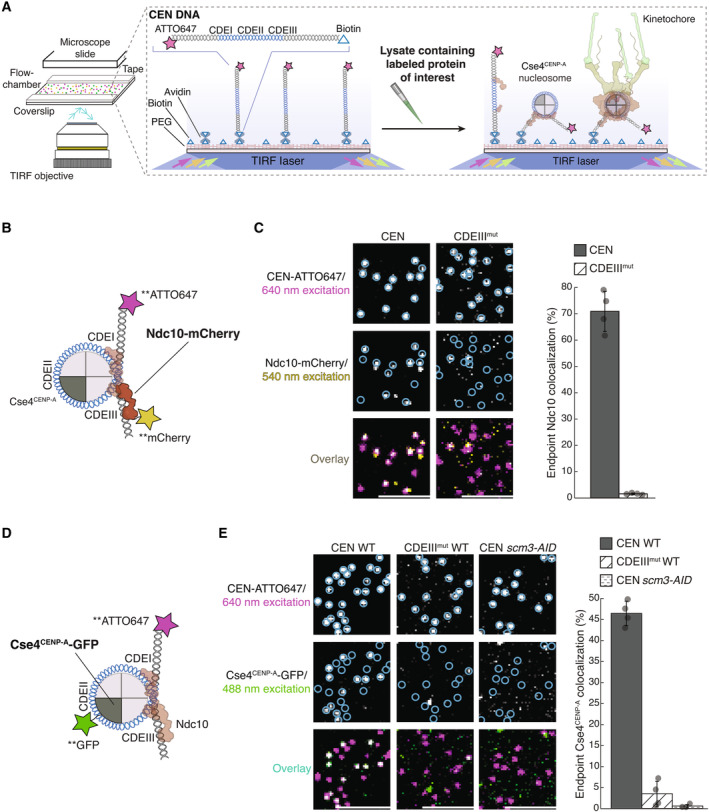
Schematic of the TIRFM colocalization assay. Yeast lysate containing a fluorescent protein(s) of interest is added to a coverslip with immobilized fluorescent CEN DNA. After incubation, the lysate is washed from the chamber and the CEN DNA and fluorescent kinetochore proteins are imaged via TIRFM.
Schematic of fluorescent label location around the centromeric nucleosome used in (C) for colocalization imaging.
Example images of TIRFM endpoint colocalization assays. Top panels show CEN DNA (Top‐left panel, blue circles) or CDEIIIMUT CEN DNA (top‐right panel, blue circles) visualized in lysates containing Ndc10‐mCherry. Middle panels show the visualized Ndc10‐mCherry on CEN DNA (middle‐left panel) or CDEIIIMUT DNA (middle‐right panel) with colocalization shown in relation to blue DNA circles. Bottom panels show overlay of DNA channel (magenta) with Ndc10‐mCherry (yellow) on CEN DNA (bottom‐left panel) or CDEIIIMUT DNA (bottom‐right panel). Scale bars 3 μm. Graph shows the quantification of Ndc10 endpoint colocalization on CEN DNA and on CDEIIIMUT CEN DNA (70 ± 7.6%, 1.6 ± 0.3% respectively, avg ± s.d. n = 4 experiments, each examining ~1,000 DNA molecules from different extracts).
Schematic of fluorescent label location around the centromeric nucleosome used in (E) for colocalization imaging.
Example images of TIRFM endpoint colocalization imaging. Top panels show CEN DNA (top‐left panel, blue circles) or CDEIIIMUT CEN DNA (top‐middle panel, blue circles) visualized in lysates that included Cse4CENP‐A‐GFP or CEN DNA in lysates that lacked Scm3HJURP (scm3‐AID) (top‐right panel, blue circles). Middle panels show Cse4CENP‐A‐GFP visualized on CEN DNA (middle‐left panel) or CDEIIIMUT CEN DNA (center panel) or on CEN DNA in lysates lacking Scm3HJURP (scm3‐AID) (middle‐right panel) with colocalization shown in relation to blue DNA circles. Bottom panels show overlay of CEN DNA channel (magenta) with Cse4CENP‐A‐GFP (green) on CEN DNA (bottom‐left panel) or CDEIIIMUT DNA (bottom‐middle panel) or on CEN DNA in lysates lacking Scm3HJURP (scm3‐AID) (bottom‐right panel). Scale bars 3 μm. Graph shows quantification of observed colocalization of Cse4 on CEN DNA and on CDEIIIMUT CEN DNA or on CEN DNA in lysates that lacked Scm3HJURP (47 ± 2.9%, 3.5 ± 3.0% and 0.6 ± 0.4% respectively, avg ± s.d. n = 4 experiments, each examining ~1,000 DNA molecules from different extracts).

