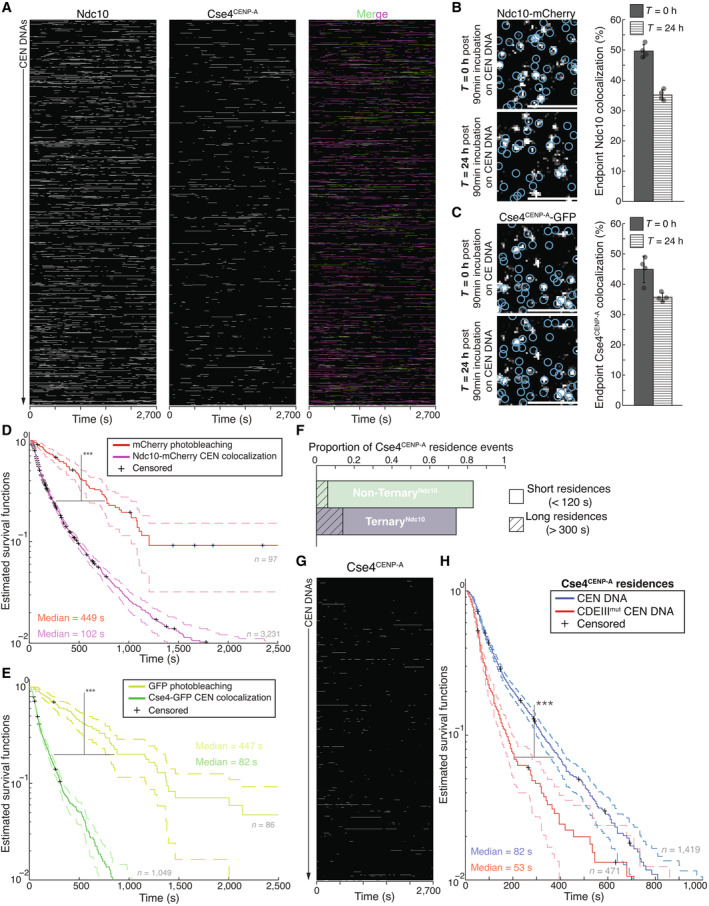
Example plot of Ndc10 and Cse4CENP‐A residence pulses on CEN DNA identified via residence lifetime assays during an entire imaging sequence acquisition. Each row represents one identified CEN DNA with all identified residences shown over entire imaging sequence (2,700 s) for Ndc10 (left) and Cse4CENP‐A (center) with merge of Ndc10 (magenta) and Cse4CENP‐A (green) indicating ternary residences (white).
Example images of TIRFM endpoint colocalization assays. Visualized Ndc10‐mCherry on CEN DNA after 90 min incubation and removal of lysate (0 h ‐top panel) or after 24 h incubation at RT in imaging buffer (bottom panel) with colocalization shown in relation to identified CEN DNA in blue circles. Scale bars 3 μm. Graph shows quantification of Ndc10 endpoint colocalization on CEN DNA at 0 h and 24 h (50 ± 2.2%, 35 ± 1.7% respectively, avg ± s.d. n = 4 experiments, each examining ~1,000 DNA molecules from different extracts).
Example images of TIRFM endpoint colocalization assays. Visualized Cse4CENP‐A GFP on CEN DNA after 90 min incubation and removal of lysate (0 h—top panel) or after 24 h incubation at RT in imaging buffer (bottom panel) with colocalization shown in relation to identified CEN DNA in blue circles. Scale bars 3 μm. Graph shows quantification of Cse4CENP‐A endpoint colocalization on CEN DNA at 0 and 24 h (45 ± 4.4%, 36 ± 1.4% respectively, avg ± s.d. n = 4 experiments, each examining ~1,000 DNA molecules from different extracts).
Kaplan–Meier analysis of mCherry photobleaching events (red—median photobleaching lifetimes of 449 s (n = 97)) and Ndc10 residences on CEN DNA (magenta—median lifetime of 102 s (n = 3,231)). There was a significant difference between mCherry photobleaching lifetimes and Ndc10 residence lifetime survival plots (***) on CEN (two‐tailed P‐value of 0 as determined by log‐rank test). 95% confidence intervals indicated (dashed lines), right‐censored lifetimes (plus icons) were included and unweighted in survival function estimates.
Kaplan–Meier analysis of GFP photobleaching events (yellow—median photobleaching lifetime of 447 s (n = 86)) and Cse4CENP‐A residences on CEN DNA (red—median colocalization lifetime of 88 s (n = 1,054)). There was a significant difference between GFP photobleaching lifetimes and Cse4CENP‐A residence lifetime survival plots (***) on CEN DNA (two‐tailed P‐value of 0 as determined by log‐rank test). 95% confidence intervals indicated (dashed lines), right‐censored lifetimes (plus icons) were included and unweighted in survival function estimates.
Quantification of the proportion of short residences (< 120 s) and long residences (> 300 s) of Non‐TernaryNdc10 Cse4CENP‐A residences (0.77 and 0.06 respectively, n = 612 over three experiments of ~1,000 DNA molecules using different extracts) or TernaryNdc10 Cse4CENP‐A (0.60 and 0.14 respectively, n = 539 over three experiments of ~1,000 DNA molecules using different extracts).
Example plot of residences of Cse4CENP‐A on CDEIIImut CEN DNA per imaging sequence. Each row represents one identified CEN DNA with all identified residences shown over entire imaging sequence (2,700 s) for Cse4CENP‐A.
Cse4CENP‐A residence lifetimes on CDEIIImut CEN DNA are reduced. Estimated survival function plots of Kaplan–Meier analysis of residence lifetimes of Cse4CENP‐A on CEN DNA (blue—median lifetime of 82 s, n = 1,419 over three experiments of ~1,000 DNA molecules using different extracts) and residences on CDEIIImut CEN DNA of Cse4CENP‐A (red—of 52 s, n = 471 over three experiments of ~1,000 DNA molecules using different extracts). There was a significant difference (***) between CEN DNA and CDEIIImut CEN DNA lifetime survival plots (two‐tailed P‐value of 0 as determined by log‐rank test). 95% confidence intervals indicated (dashed lines), right‐censored lifetimes (plus icons) were included and unweighted in survival function estimates.

