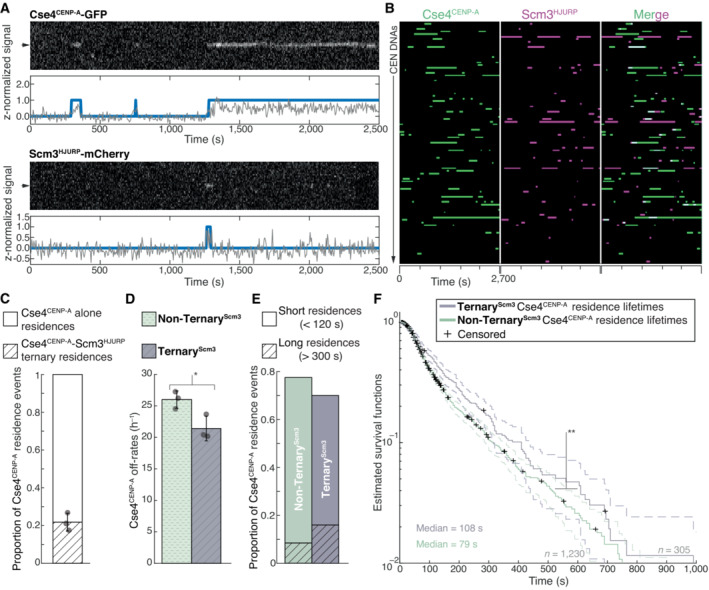
Representative residence lifetime assay traces of Cse4CENP‐A and Scm3HJURP on a single CEN DNA. Top panel includes kymograph of Cse4CENP‐A (top‐488 nm) in relation to single identified CEN DNA (arrow), with normalized intensity trace (gray‐bottom) as well as identified residences (blue). Bottom panel includes kymograph of Cse4CENP‐A (bottom‐568 nm) in relation to the same identified CEN DNA (arrow), with normalized intensity trace (gray‐bottom) as well as identified residences (blue). Images acquired every 5 s with normalized fluorescence intensity shown in arbitrary units.
Example plot of total identified residences observed on CEN DNA per imaging sequence. Each row represents one identified CEN DNA with all identified residences shown over entire imaging sequence (2,700 s) for Cse4
CENP‐A (green) and Scm3
HJURP (magenta). Cases where Scm3
HJURP and Cse4
CENP‐A residence coincides represent simultaneous observation of both proteins on single CEN DNA, termed ternary residence (merge, white). Complete plot shown in Fig
EV2A.
Quantification of the proportion of Cse4CENP‐A and Scm3HJURP ternary residences with CEN DNA compared to CEN DNA residences of Cse4CENP‐A alone (0.22 ± 0.05 and 0.78 ± 0.05 respectively, avg ± s.d. n = 1,419 over three experiments of ~1,000 DNA molecules using different extracts). Ternary residences include simultaneous Scm3HJURP residence at any point during continuous Cse4CENP‐A residence on CEN DNA.
Quantification of the estimated off‐rates of Cse4CENP‐A that never formed a ternary residence (Non‐TernaryScm3) and of Cse4CENP‐A after ternary residence with Scm3HJURP (TernaryScm3) on CEN DNA (26 h−1 ± 1 h−1 and 21 h−1 ± 2 h−1 respectively, avg ± s.d. n = 1,535 over three experiments of ~1,000 DNA molecules using different extracts). Significant difference between off‐rates (*) with a P‐value of 0.03 as determined by two‐tailed unpaired t‐test.
Quantification of the proportion of short residences (< 120 s) and long residences (> 300 s) of Cse4CENP‐A alone or in ternary residences on CEN DNA. Short and long Non‐TernaryScm3 Cse4CENP‐A residences (0.69 and 0.08 respectively, n = 1,063 over three experiments of ~1,000 DNA molecules using different extracts) and short and long TernaryScm3 Cse4CENP‐A residences (0.54 and 0.16 respectively, n = 305 over three experiments of ~1,000 DNA molecules using different extracts).
Longer residence lifetimes are measured for Cse4CENP‐A after Scm3HJURP colocalizes. Estimated survival function plots of Kaplan–Meier analysis of the lifetimes of TernaryScm3 Cse4CENP‐A residences on CEN DNA (purple—median lifetime of 108 s, n = 305 over three experiments of ~1,000 DNA molecules using different extracts) and Non‐TernaryScm3 Cse4CENP‐A residences on CEN DNA (green—of 79 s, n = 1,230 over three experiments of ~1,000 DNA molecules using different extracts). Significant difference (**) between TernaryScm3 and Non‐TernaryScm3 lifetime survival plots (two‐tailed P‐value of 2.1e‐3 as determined by log‐rank test). 95% confidence intervals indicated (dashed lines), right‐censored lifetimes (plus icons) were included and unweighted in survival function estimates.

