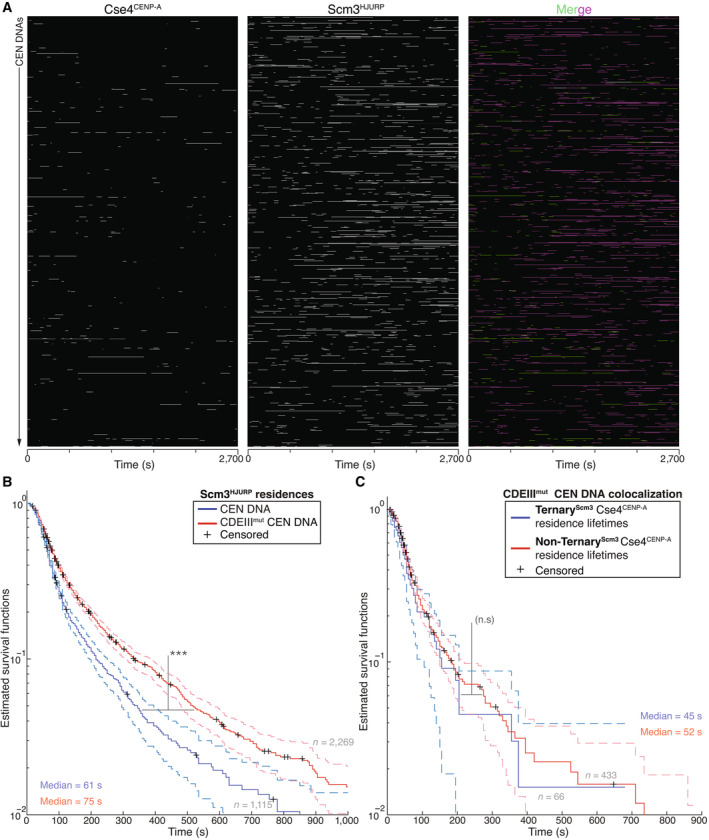
Example plot of residences of Cse4CENP‐A and Scm3HJURP on CDEIIImut CEN DNA per imaging sequence. Each row represents one identified CEN DNA with all identified residences shown over entire imaging sequence (2,700 s) for Cse4CENP‐A (left) and Scm3HJURP (center) with merge indicating Cse4CENP‐A (green), Scm3HJURP (magenta) and ternary residences (white).
Scm3HJURP residences are longer on CDEIIImut CEN DNA. Estimated survival function plots of Kaplan–Meier analysis of Scm3HJURP residence lifetimes on CEN DNA (blue—median lifetime of 61 s, n = 1,115 over three experiments of ~1,000 DNA molecules using different extracts), and residence lifetimes of Scm3HJURP on CDEIIImut CEN DNA (red—median lifetime of 75 s, n = 2,269 over three experiments of ~1,000 DNA molecules using different extracts). There was a significant difference (***) between CEN DNA and CDEIIImut CEN DNA lifetime survival plots (two‐tailed P‐value of 5.13e‐13 as determined by log‐rank test). 95% confidence intervals indicated (dashed lines), right‐censored lifetimes (plus icons) were included and unweighted in survival function estimates.
Cse4CENP‐A residence lifetimes are similar without Scm3HJURP a on CDEIIImut CEN DNA. Estimated survival function plots of Kaplan–Meier analysis of ternary residence lifetimes of TernaryScm3 Cse4CENP‐A residences on CDEIIImut CEN DNA (blue—median lifetime of 45 s, n = 66 over three experiments of ~1,000 DNA molecules using different extracts) and Non‐TernaryScm3 Cse4CENP‐A residences on CDEIIImut CEN DNA (red—of 52 s, n = 433 over three experiments of ~1,000 DNA molecules using different extracts). There was no significant difference (n.s.) between Non‐TernaryScm3 and TernaryScm3 survival plots (two‐tailed P‐value of 0.27 as determined by log‐rank test). 95% confidence intervals indicated (dashed lines), right‐censored lifetimes (plus icons) were included and unweighted in survival function estimates.

