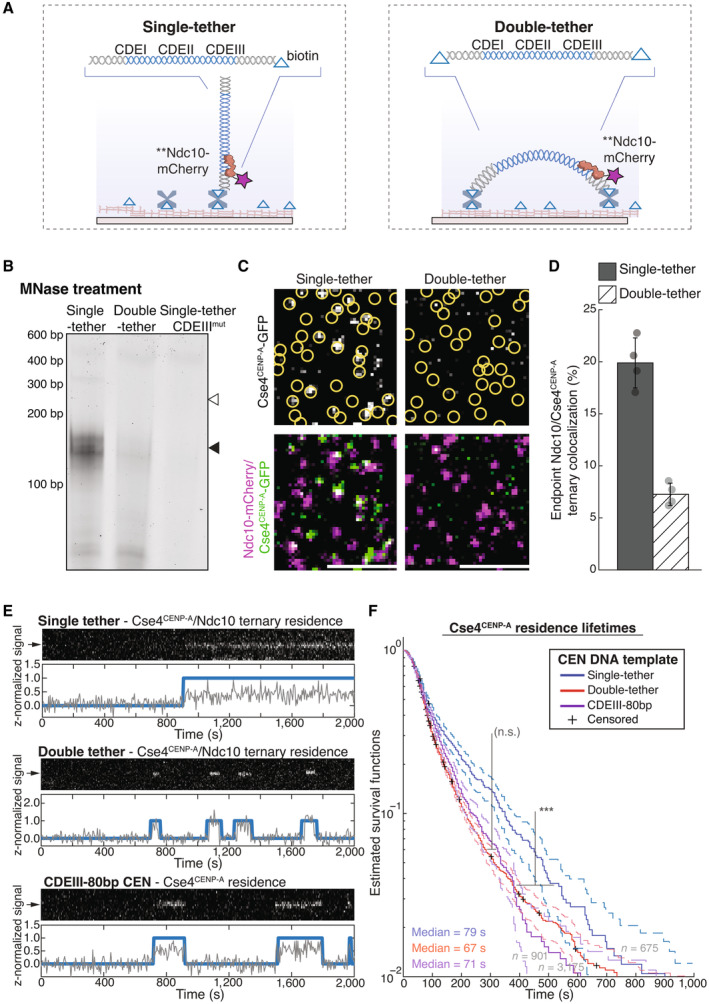
Schematic of single versus double‐tether CEN DNA TIRFM colocalization assay.
Kinetochores were assembled on beads containing either a 250 bp single‐tether, a 250 bp double‐tether or a 250 bp CDEIIImut CEN DNA. They were then treated with MNase, and the remaining DNA was visualized on an agarose gel. Black arrow indicates Cse4CENP‐A nucleosome protected DNA (~150 bp); white arrow indicates theoretical location of undigested template DNA (250 bp).
Example images of TIRFM endpoint colocalization assays. Top panels show Cse4CENP‐A/Ndc10 ternary colocalizations visualized on single‐tethered CEN DNA (top‐left panel) or on double‐tethered CEN DNA (top‐right panel) with colocalization shown in relation to Ndc10 in yellow circles. Bottom panels show overlay of Ndc10 channel (magenta) with Cse4CENP‐A (green). Scale bars 3 μm.
Quantification of observed ternary colocalization of Cse4CENP‐A with Ndc10 (right) on single‐tethered CEN DNA containing Ndc10 (19.9 ± 2.4%, avg ± s.d. n = 4 experiments, each examining ~1,000 DNA molecules from different extracts) and on double‐tethered CEN DNA (7.3 ± 1.1%, avg ± s.d. n = 4 experiments, each examining ~1,000 DNA molecules from different extracts).
Representative residence lifetime assay traces of ternary Cse4CENP‐A residences with Ndc10 on single‐tethered CEN DNA (top), double‐tethered CEN DNA (middle) or of Cse4CENP‐A residence on CDEIII‐80 bp CEN DNA (bottom). Each example includes kymographs of Cse4CENP‐A (488 nm‐top) with normalized intensity trace (gray‐bottom) as well as identified residences (blue). Images acquired every 5 s with normalized fluorescence intensity shown in arbitrary units.
Residence times for Cse4CENP‐A on double‐tethered CEN DNAs are shorter than on single‐tethered CEN DNAs and equivalent to those on non‐functional mutant CEN DNAs. Estimated survival function plots of Kaplan–Meier analysis of ternary residences of Cse4CENP‐A with Ndc10 on single‐tethered CEN DNA (blue—median lifetime of 79 s, n = 675 over three experiments of ~1,000 DNA molecules using different extracts), on double‐tethered CEN DNA (red—median lifetime of 67 s, n = 3,175 over three experiments of ~1,000 DNA molecules using different extracts) or Cse4CENP‐A lifetimes on CDEIII‐80 bp CEN DNA (purple—median lifetime of 71 s, n = 901 over three experiments of ~1,000 DNA molecules using different extracts). No significant difference (n.s.) between double‐tethered 250 bp CEN DNA and 80 bp CDEIII CEN DNA lifetime survival plots (two‐tailed P‐value of 0.06 as determined by log‐rank test). Significant difference (***) between double‐tethered 250 bp CEN DNA and 250 bp single‐tether DNA lifetime survival plots (two‐tailed P‐value of 1.4e‐10 as determined by log‐rank test). 95% confidence intervals indicated (dashed lines), right‐censored lifetimes (plus icons) were included and unweighted in survival function estimates.

