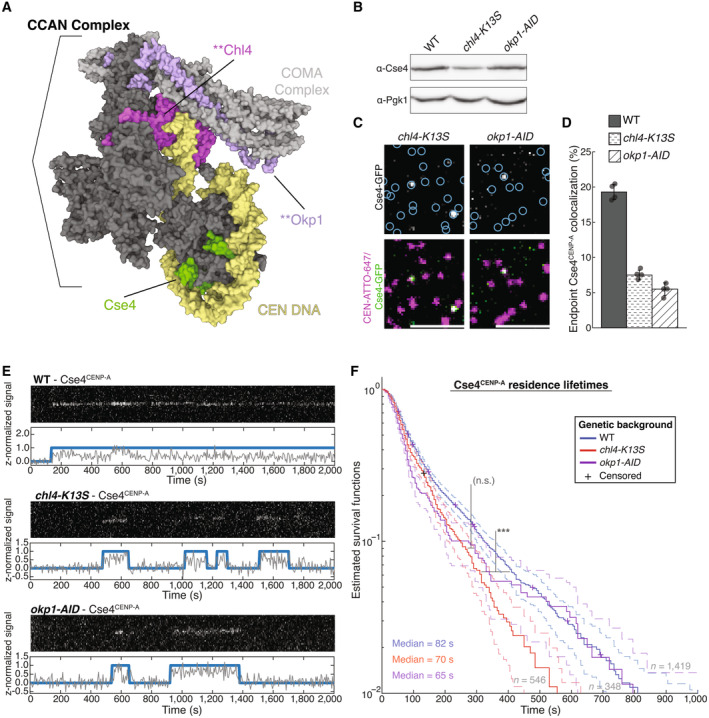
Structure of the yeast CCAN in complex with Cse4
CENP‐A with CEN DNA (yellow), Cse4
CENP‐A (green), Chl4
CENP‐N (magenta) and Okp1
CENP‐Q (purple), highlighting DNA‐adjacent regions targeted by the
chl4‐K13S mutant or proteasomal degradation of Okp1
CENP‐Q (
okp1‐AID). Image of 6QLD (Yan
et al,
2019) created with Mol* (Sehnal
et al,
2021).
Immunoblot analysis of whole cell extracts from WT, chl4‐K13S and okp1‐AID cells using indicated antibodies.
Example images of TIRFM endpoint colocalization assays. Top panels show visualized Cse4CENP‐A‐GFP on CEN DNA in extracts from chl4‐K13S (top‐left panel) or auxin‐treated okp1‐AID strains (okp1‐AID, top‐right panel) with colocalization shown in relation to identified CEN DNA in blue circles. Bottom panels show overlay of CEN DNA channel (magenta) with Cse4CENP‐A‐GFP (green), Scale bars 3 μm.
Quantification of Cse4CENP‐A endpoint colocalization with CEN DNA in extracts from WT, chl4‐K13S, or okp1‐AID genetic backgrounds (19 ± 1.1%, 8 ± 0.7%, 5 ± 0.9%, avg ± s.d. n = 4 experiments, each examining ~1,000 DNA molecules from different extracts).
Representative residence traces of Cse4CENP‐A signal on CEN DNA in WT (top), chl4‐K13S (middle), or okp1‐AID (bottom) extracts. Each example includes kymographs of Cse4CENP‐A (488 nm‐top) with normalized intensity trace (gray‐bottom) as well as identified residences (blue). Images acquired every 5 s with normalized fluorescence intensity shown in arbitrary units.
Kaplan–Meier analysis of Cse4CENP‐A residence lifetimes on CEN DNA in extracts from WT (blue—median lifetime of 82 s, n = 1,419 over three experiments of ~1,000 DNA molecules using different extracts), chl4‐K13S (red—median lifetime of 70 s, n = 546 over three experiments of ~1,000 DNA molecules using different extracts) and okp1‐AID (purple—median lifetime of 61 s, n = 348 over three experiments of ~1,000 DNA molecules using different extracts) genetic backgrounds. Significant difference (***) between WT extract and chl4‐K13S extract residence lifetime plots (two‐tailed P‐value of 3.4e‐5 as determined by log‐rank test). No significant difference (n.s.) between chl4‐K13S and okp1‐AID residence lifetimes in (two‐tailed P‐value of 0.40 as determined by log‐rank test). 95% confidence intervals indicated (dashed lines), right‐censored lifetimes (plus icons) were included and unweighted in survival function estimates.

