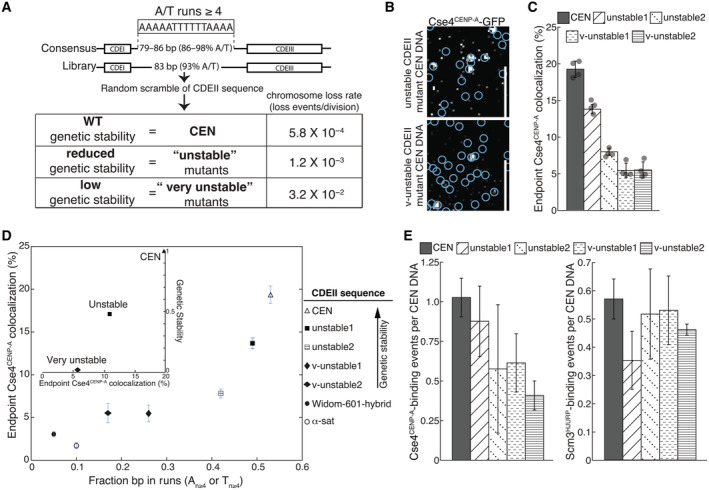
Overview of CDEII mutants generated for stability assays where overall % of A/T content was maintained while A/T run content was randomly varied and selected for genetic stability including reported chromosome loss rates of WT and CDEII mutant pools (adapted from Baker & Rogers,
2005).
Example images of TIRFM endpoint colocalization assays. Visualized Cse4CENP‐A‐GFP on unstable1 CDEII‐mutant DNA (top panel) or on v‐unstable1 CDEII‐mutant DNA (bottom panel) with colocalization shown in relation to identified CEN DNA in blue circles. Scale bars 3 μm.
Quantification of endpoint colocalization of Cse4CENP‐A on CEN, unstable1, unstable2, v‐unstable1, and v‐unstable2 CEN DNA (19.3 ± 1.1%, 13.8 ± 0.6%, 7.8 ± 0.5%, 5.5 ± 1.0%, 5.5 ± 1.1%, avg ± s.d. n = 4 experiments, each examining ~1,000 DNA molecules from different extracts).
Stable Cse4CENP‐A recruitment depends upon CDEII sequence A/T run content. Plot of fraction of all CDEII bp that occur in homopolymeric A
n ≥ 4 or T
n ≥ 4 repeats (fraction bp in runs, N ≥ 4) in CEN, unstable1, unstable2, v‐unstable1, v‐unstable2, Widom‐601 hybrid and α‐sat CEN DNA (0.53, 0.49, 0.41, 0.26, 0.17, 0.05, 0 0.10), versus the observed colocalization of Cse4CENP‐A on CEN, unstable1 unstable2, v‐unstable1, v‐unstable2, Widom‐601 hybrid and α‐sat CEN DNA (19.3 ± 1.1%, 13.8 ± 0.6%, 7.8 ± 0.5%, 5.5 ± 1.0%, 5.5 ± 1.1%, 3.1 ± 0.3%, 1.7 ± 0.4%, avg ± s.d. n = 4). Inset plot of Cse4CENP‐A endpoint colocalization percentage on CEN, unstable mutants (average), and very unstable mutants (average) (19.9, 10.8, and 5.5% respectively) versus genetic stability (chromosome loss normalized to CEN) of WT, unstable mutants, and very unstable mutants (1.0, 0.48, and 0.02, respectively).
Very unstable CDEII mutants have reduced average Cse4CENP‐A binding when compared to unstable counterparts. Average residences of Cse4CENP‐A per CEN DNA (left) on CEN, unstable1, unstable2, v‐unstable1, and v‐unstable2 CEN DNA (1.03 ± 0.12, 0.88 ± 0.22, 0.58 ± 0.41, 0.61 ± 0.18, 0.41 ± 0.09, avg ± s.e.m. n = 3 experiments of ~1,000 DNA molecules using different extracts) and average residences of Scm3HJURP per CEN DNA (right) on CEN, unstable1, unstable2, v‐unstable1, and v‐unstable2 CEN DNA (0.57 ± 0.07, 0.35 ± 0.10, 0.52 ± 0.16, 0.53 ± 0.12, 0.46 ± 0.02, avg ± s.e.m. n = 3 experiments of ~1,000 DNA molecules using different extracts).

