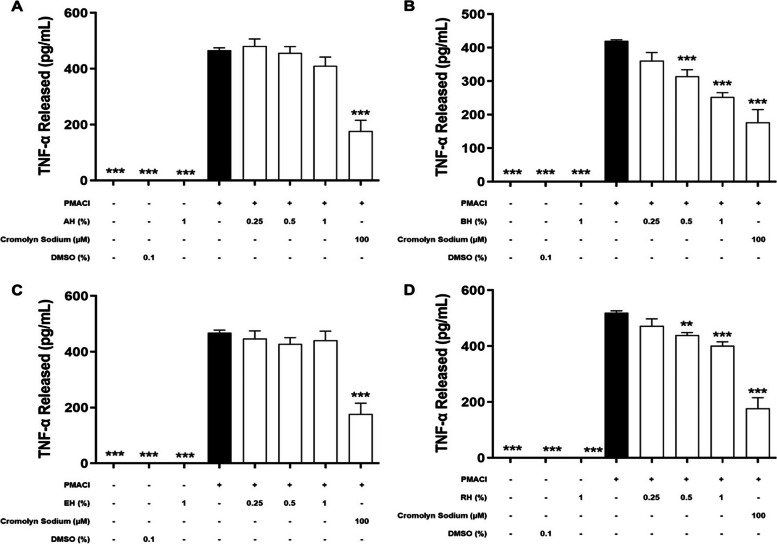
Fig. 4.
The effects of (A) BH, (B) RH, (C) MH, and (D) EH on the levels of TNF-α released by PMACI-induced HMC-1 cells. PMACI-induced cells were pre-treated without (normal control) or with increasing concentrations of honey (0.25, 0.5, and 1%) for 1 h followed by a 24 h induction with PMACI. The cromolyn sodium treatment group was used as a positive control. The level of TNF-α released was determined using an ELISA kit according to the manufacturer’s protocol. Results obtained from three repeated independent experiments are expressed as mean standard error of mean (SEM). ** P < 0.01 and *** P < 0.005 as compared to the normal control group (black bars)

