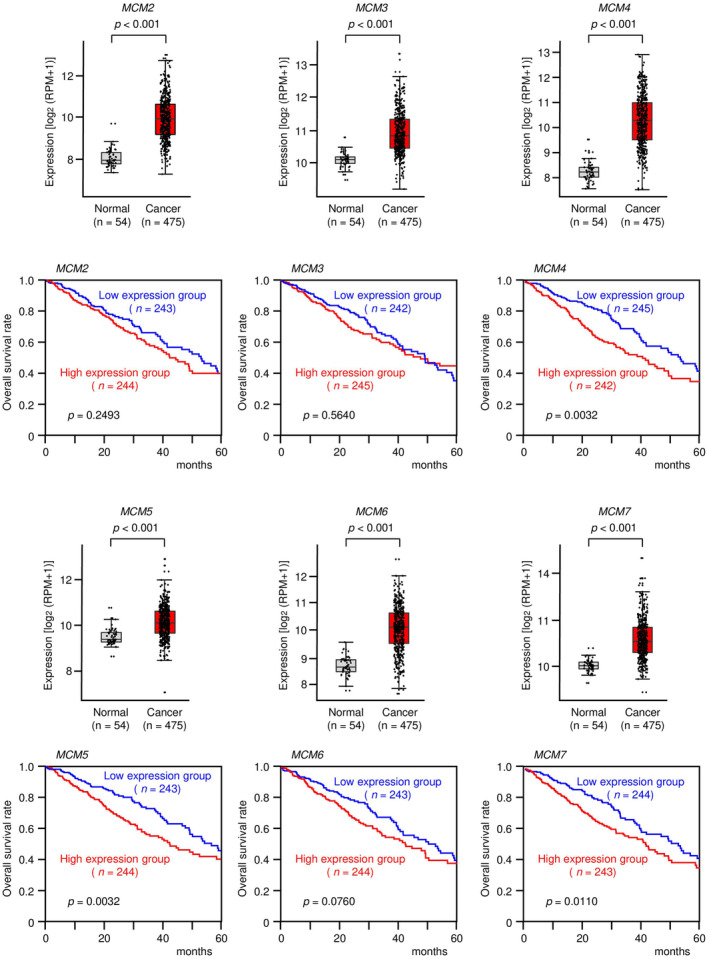
Fig. 1.

Expression levels of MCM2, MCM3, MCM4, MCM5, MCM6, and MCM7 and association with overall survival in patients with LUAD. The expression levels of six genes (MCM2, MCM3, MCM4, MCM5, MCM6, and MCM7) in normal and cancer tissues were evaluated using data from TCGA database. In total, 475 LUAD tissues and 54 normal lung tissues were analyzed. The lower and upper hinges represent the 25th and 75th percentiles, respectively. The lower/upper whiskers represent the lowest/largest points inside the range defined by the first/third quartiles ± 1.5 times the IQR, respectively. Dots represent individual samples. Student's t‐test. Kaplan–Meier 5‐year overall survival curves were created from TCGA data. Patients were divided into high‐ and low‐expression groups according to miRNA expression (based on median expression). The red line shows the high‐expression group, and the blue line shows the low‐expression group. Log‐rank test. RPM, reads per million.
