Fig. 3.

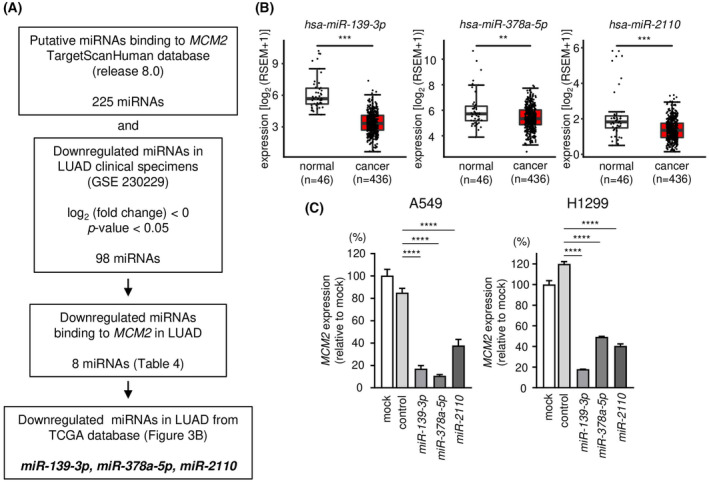
Selection of miRNAs regulating MCM2 in LUAD cells. (A) This shows a flowchart for the strategy to identify the candidate of miRNAs regulating MCM2 in LUAD cells. (B) The expression levels of miR‐139‐3p, miR‐378a‐5p, and miR‐2110 were evaluated in a LUAD dataset from TCGA. A total of 436 LUAD tissues and 46 normal lung tissues were analyzed. The lower and upper hinges represent the 25th and 75th percentiles, respectively. The lower/upper whiskers represent the lowest/largest points inside the range defined by first/third quartile ± 1.5 times IQR, respectively. Dots mean each sample. Student's t‐test. (C) mRNA expressions of MCM2 were evaluated by RT‐qPCR. Internal control was the expression of GAPDH. The time for transfection is 72 h. RT‐qPCR was measured in triplicate. The data are mean and SD. One‐way ANOVA and Tukey tests for post hoc analysis. **P < 0.01, ***P < 0.001, ****P < 0.001. RSEM, RNA‐seq by Expectation‐Maximization.
