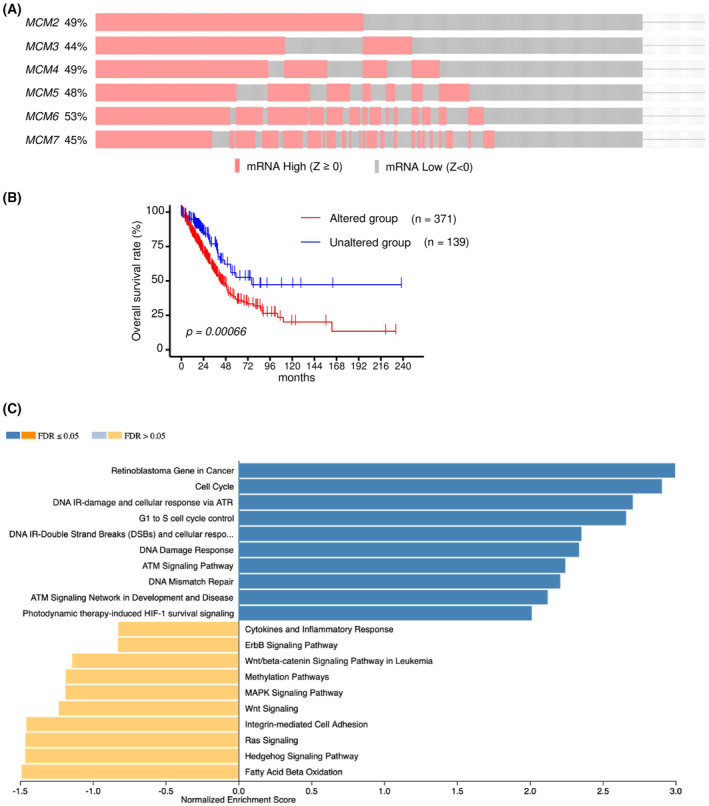
Fig. 5.

MCM family mRNA expression alternations in LUAD clinical specimens from TCGA‐LUAD analyses. (A) Oncoprint of TCGA‐LUAD on cBioPortal filtered by the mRNA expression (Z‐score ≥0) from the query for genes. (B) Kaplan–Meier curves of overall survivals between altered and unaltered groups. (C) Bar chart and enrichment plots of GSEA of alteration of MCM family. FDR, false discovery rate.
