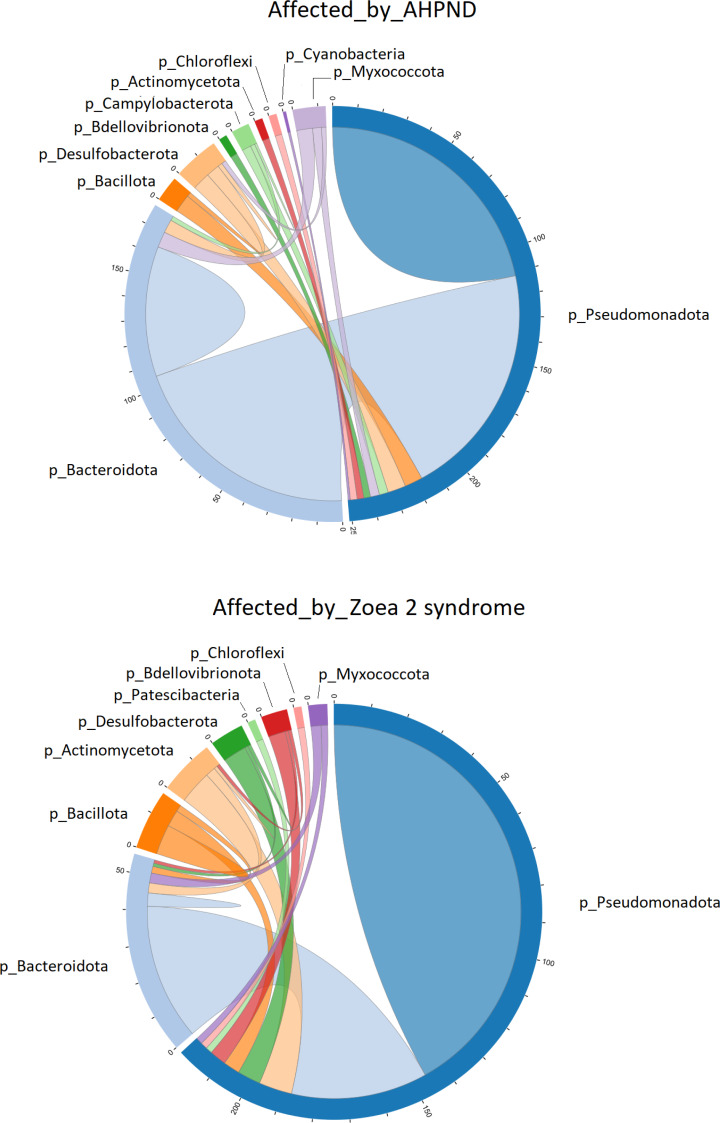
Figure 4. Co-occurrence network of bacterial communities present in the larval microbiome of samples collected from tanks affected by AHPND and zoea 2 syndrome.
The numbers along the outside of the pie chart represent the number of ASVs that are related to the phylum. An edge indicates a strong (Spearman correlation > 0.6) and significant (P < 0.01) correlation.

