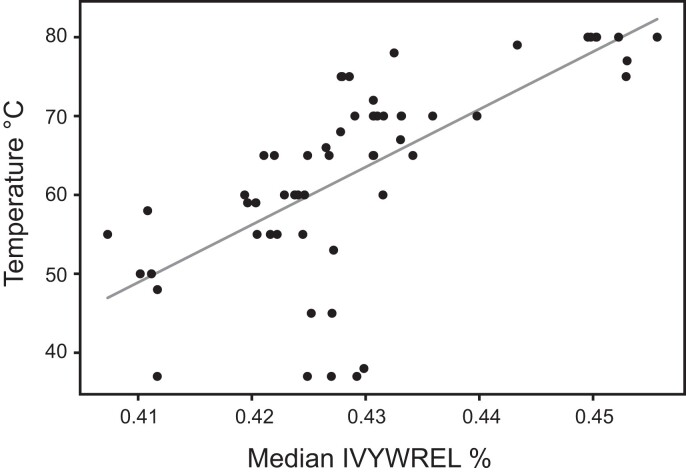
Fig. 3.
—Correlation of OGT in the described Thermotogota species with the median IVYWREL amino acid composition bias in proteins encoded in their genomes (R2 = 0.46, mean squared error = 78.06, y = 731.0x − 250.8). Each point represents a genome of a species. The median IVYWREL bias was calculated from IVYWREL biases of all cytosolic proteins encoded in a genome (see Materials and Methods for details).

