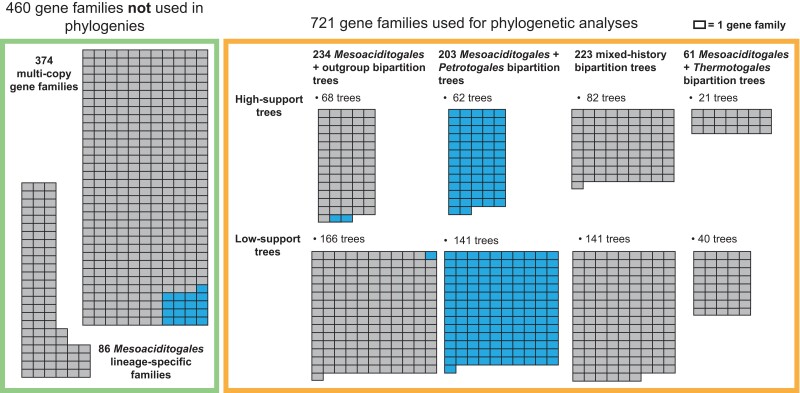
Fig. 4.
—The distribution of phylogenetic relationships in Thermotogota gene families that contain Mesoaciditogales. Each rectangle represents one gene family. Gene families in the green box (on the left) were analyzed only for taxonomy of their members. Gene families in the orange box (on the right) underwent phylogenetic reconstruction. The latter gene families are subdivided into categories based on the taxonomic composition of their “minimum bipartition” and the support of that bipartition (high-support trees have QP-IC score ≥ 0.3 and bootstrap support ≥ 50%). Petrotogales-associated gene families (see text for definition) are shaded in blue.

