Figure 1.
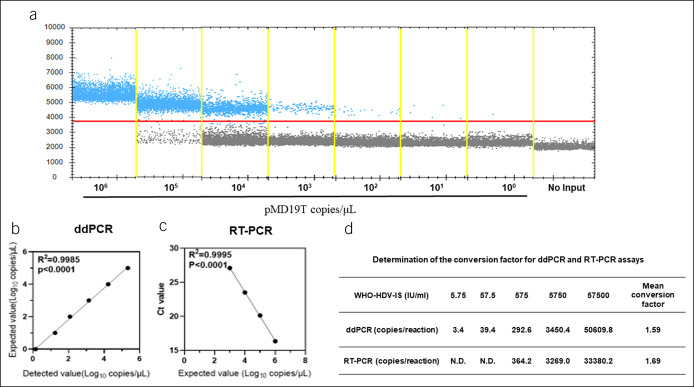
Sensitivity and dynamic range of the ddPCR assay to detect HDV. Data are representative of at least 3 independent experiments. (a) The 10-fold serial dilution of pMD19T plasmid is analyzed by the ddPCR; the blue points represent a positive signal. (b) Correlation analysis to determine the dynamic range of the ddPCR. The expected values (converted to log10) of pMD19T were plotted on the Y axis vs detected values (converted to log10) on the X axis to perform linear analysis. (c) Correlation analysis to determine the dynamic range of RT-PCR. The Ct values reported by the RT-PCR were plotted on the Y axis vs expected values (converted to log10) of pMD19T on the X axis to perform linear analysis. (d) Determination of the conversion factors for ddPCR and RT-PCR assays. The 10-fold serial dilutions of WHO-HDV-IS were tested by ddPCR and RT-PCR assays, and the conversion factors were calculated by dividing the given concentrations of standards by the results of ddPCR and RT-PCR assays. ddPCR, digital droplet PCR; HBV, hepatitis B virus; HDV, hepatitis delta virus; RT-PCR, reverse-transcriptase PCR; WHO-HDV-IS, World Health Organization-HDV international standard.

