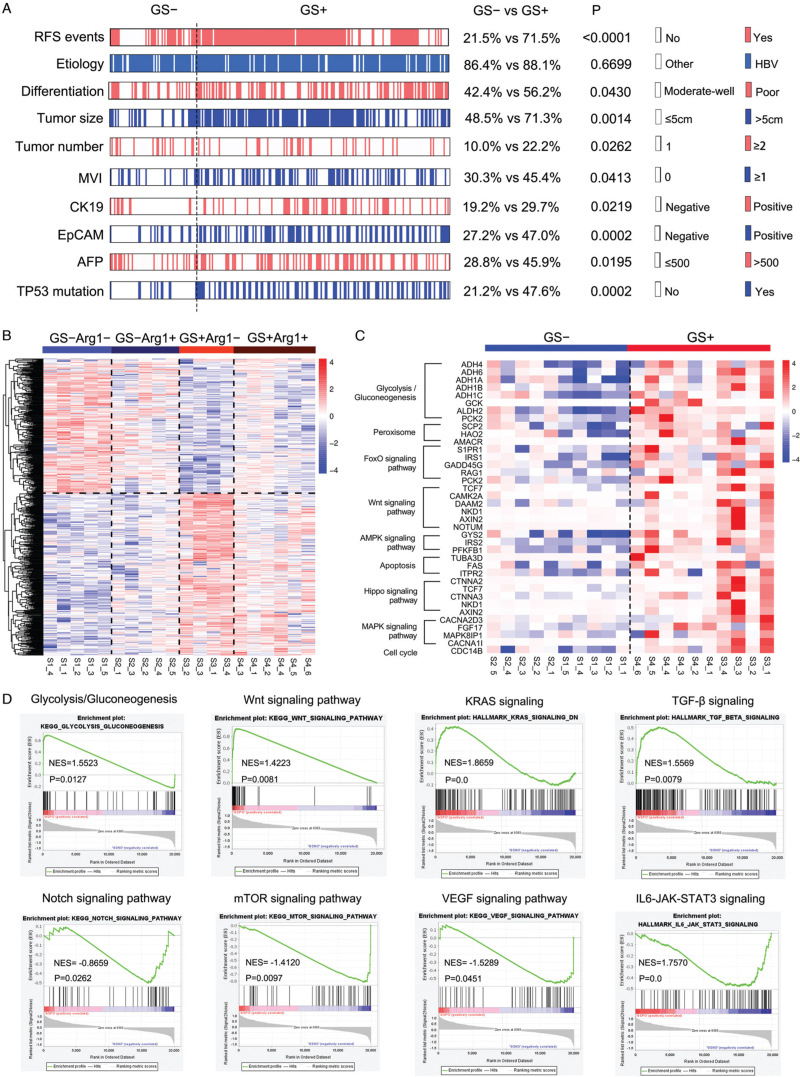
Figure 5.
Analysis of gene expression profiles in HCC tumors with different GS and Arg1 expression levels. (A) Heatmap of multiple indicators after grouping according to GS expression in 251 HCC patients who received only hepatectomy. (B) Heatmap of differentially expressed genes. (C) Abnormal activation of multiple signaling pathways in GS+ HCC tumors. (D) GSEA graphs depicting enrichment of Wnt, KRAS, and TGF-β in GS+ tumors and of Notch, mTOR, and JAK-STAT3 in GS− tumors. Arg1: Arginase 1; GSEA: Gene set enrichment analysis; GS: Glutamine synthetase; GS−: GS negative; GS+: GS positive; HCC: Hepatocellular carcinoma.

