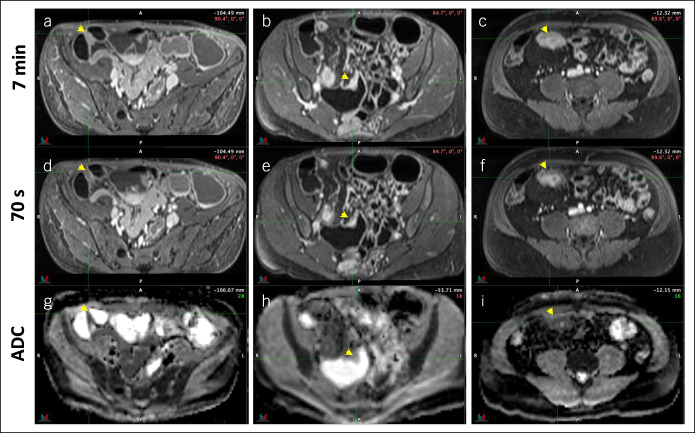
Figure 2.
Representative contrast-enhanced sequences acquired at 7 minutes (a, b, and c) and 70 seconds (d, e, and f) post-Gd administration and apparent diffusion coefficient (ADC) sequences (g, h, and i) from 3 patients with different histological grades of inflammation and fibrosis. Panels a, d, and g are from a patient with low inflammation (grade 1) and low fibrosis (grade 1). Panels b, e, and h are from a patient with low inflammation (grade 1) and moderate fibrosis (grade 2). Panels c, f, and i are from a patient with moderate inflammation (grade 2) and high fibrosis (grade 3). Arrows indicate the region from where magnetic resonance enterography measurements and associated histological samples were obtained.

