Figure 3.

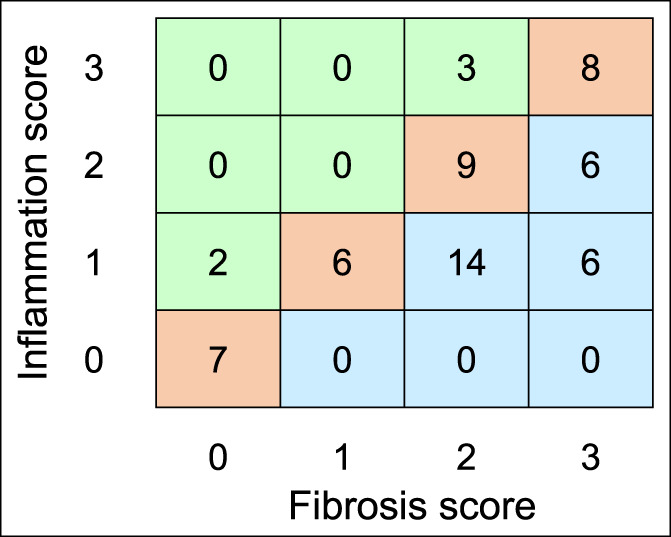
Frequency matrix of histological sample observations with each combination of inflammation and fibrosis scores. Overall, the histological scores for fibrosis and inflammation were well correlated (R = 0.66, P < 0.0001).

Frequency matrix of histological sample observations with each combination of inflammation and fibrosis scores. Overall, the histological scores for fibrosis and inflammation were well correlated (R = 0.66, P < 0.0001).