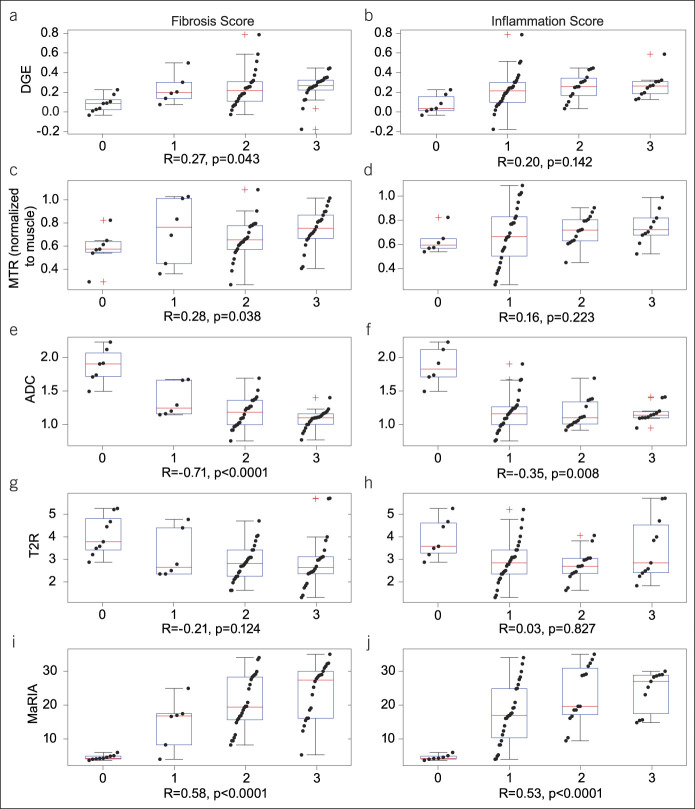
Figure 4.
Boxplots and overlaid scatter plots of each MRE metric of interest depicted against histological scores for fibrosis and inflammation for DGE (a and b), MTR (c and d), ADC (e and f), T2R (g and h), and MaRIA (i and j) to show an association between imaging and histopathology. Boxplots indicate median, quartiles, and 95% CI. Red crosses indicate outliers (beyond 95% CI). Correlation coefficients, R, and respective P values are indicated at the bottom of each comparison panel. ADC, apparent diffusion coefficient; CI, confidence interval; DGE, delayed gain of enhancement; MaRIA, magnetic resonance index of activity; MRE, magnetic resonance enterography; MTR, magnetization transfer ratio; T2R, T2-weighted magnetic resonance imaging (MRI) sequences.

