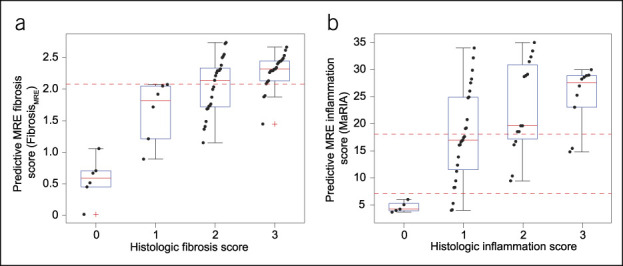
Figure 5.

Scatter and box plots of histologic fibrosis (a) and inflammation (b) scores and associated MRE predictive scores FibrosisMRE and MaRIA, respectively. Boxes are IQR, whiskers depict extreme data points, and red crosses in boxplots indicate outlier data points (beyond 99.3% of estimated normal distribution). Horizontal red dashed lines depict relevant predictive score thresholds obtained with ROC curve analysis. IQR, interquartile range; MaRIA, magnetic resonance index of activity; MRE, magnetic resonance enterography; ROC, receiver operator characteristic.
