Figure 1.

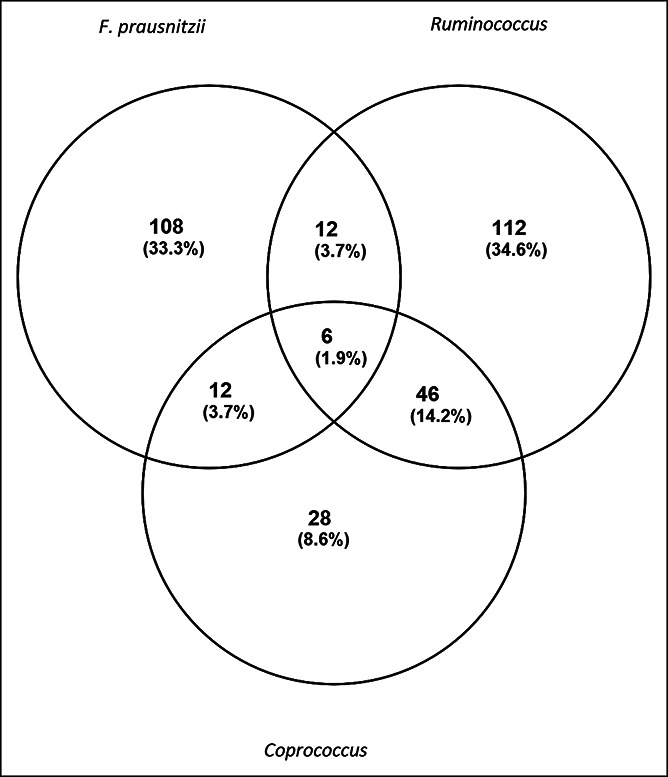
Venn diagram of hepatic genes that were differentially expressed in nonalcoholic fatty liver disease vs healthy controls and were significantly correlated with Ruminococcus spp., F. prausnitzii, and Coprococcus spp.

Venn diagram of hepatic genes that were differentially expressed in nonalcoholic fatty liver disease vs healthy controls and were significantly correlated with Ruminococcus spp., F. prausnitzii, and Coprococcus spp.