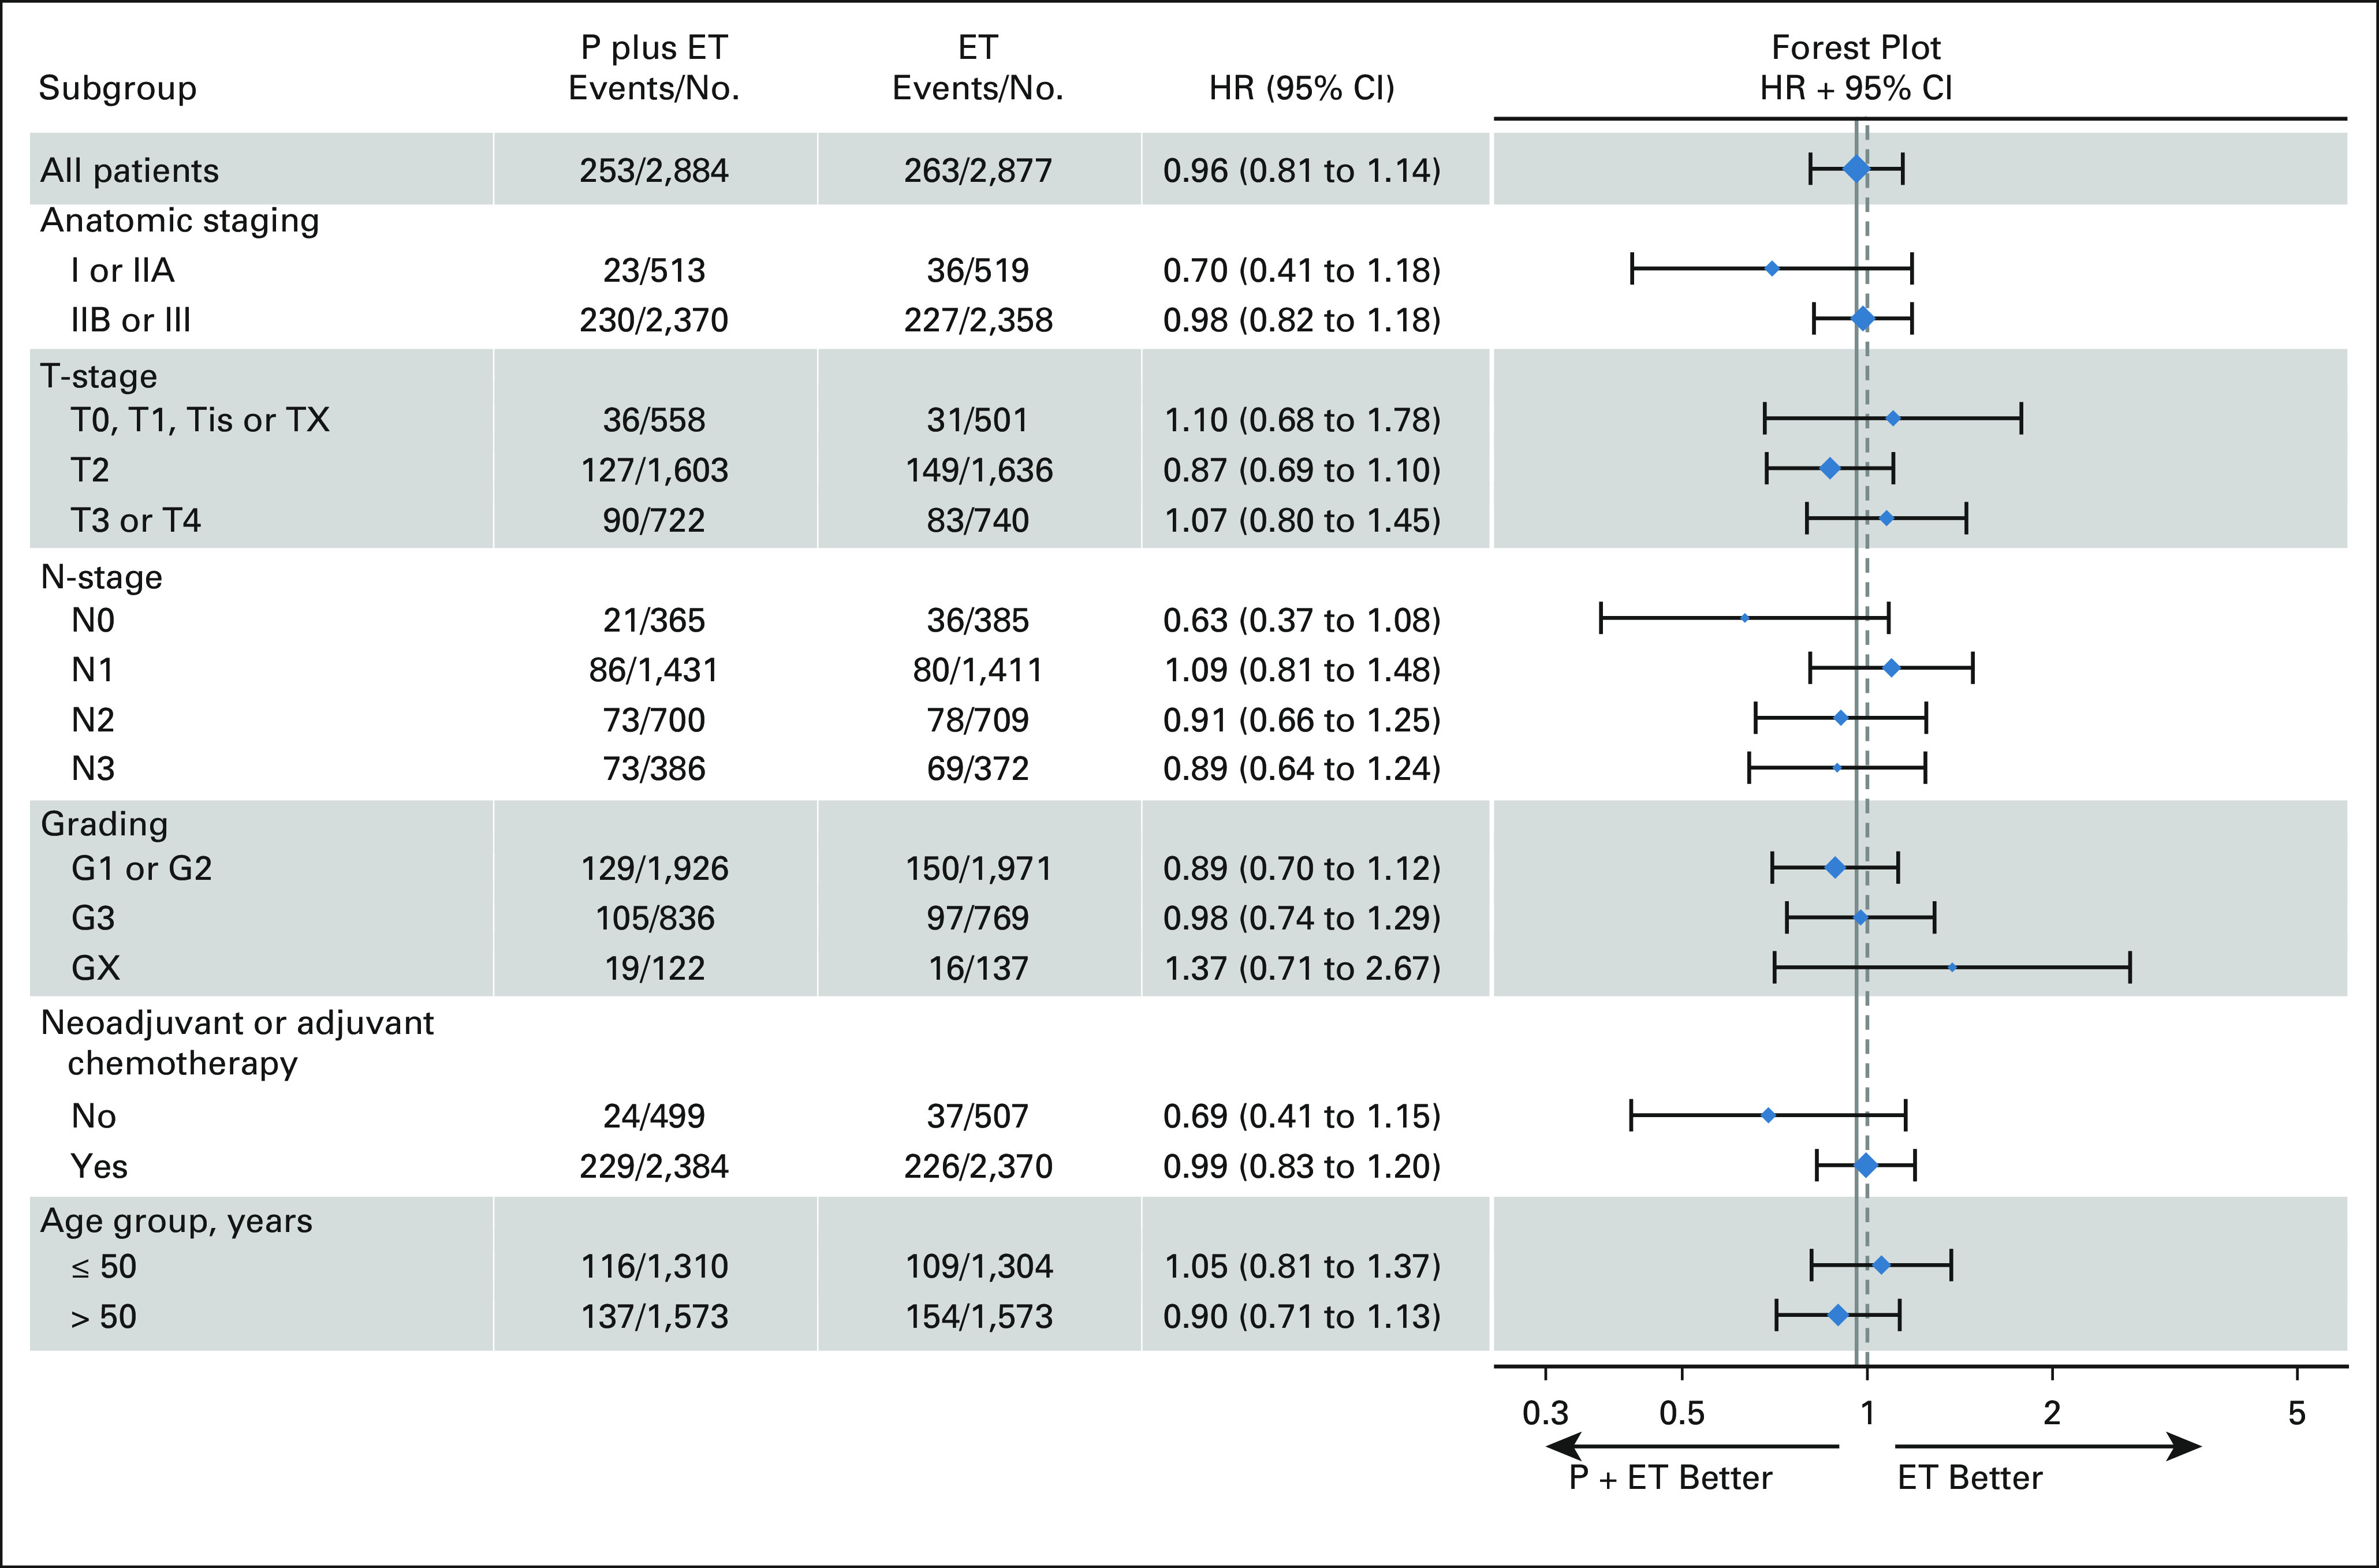
FIG 3.

The forest plot shows the HRs (diamonds) and 95% CIs (horizontal lines) with regard to invasive disease-free survival within subgroups according to anatomic stage, tumor stage (T-stage), nodal status (N-stage), histologic grade, prior neoadjuvant or adjuvant chemotherapy, and age group. The solid vertical line indicates the overall HR estimate, and the dashed vertical line indicates a HR of 1.00. No significant interactions between subgroups and treatment groups were observed. ET, endocrine treatment; HR, hazard ratio; P, palbociclib.
