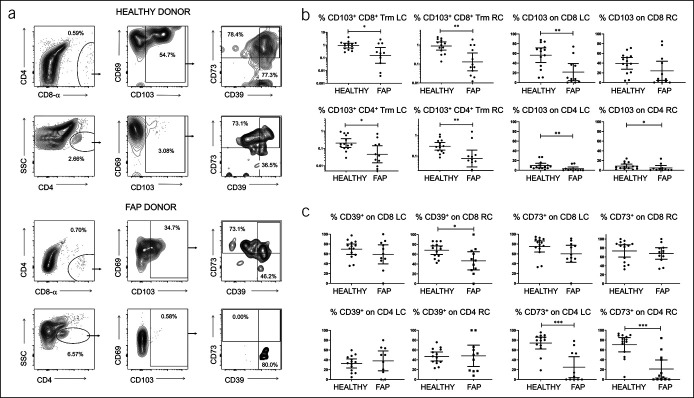
Figure 2.
Reduced CD103 and CD73 expression on lamina propria T cells in FAP. (a) Comparison of LPL staining profiles from representative healthy control (upper panels) and FAP (lower panels) colonic biopsies, reflecting loss of CD103 on CD4+ and CD8+ T cells and CD73 expression on CD4+ T cells (lower panels). (b) Percentages of CD8+ (upper panels) and CD4+ (lower panels) CD103+ Trm, as proportions of total LPL (left) in the left and right colon of healthy vs FAP donors. Right-hand graphs show proportions expressing CD103 within gated T-cell fractions. (c) Expression of regulatory T-cell markers CD39 and CD73 on CD4 and CD8 Trm in LPL. Median values ± 95% confidence intervals are shown; statistically significant differences between groups (Mann-Whitney tests) are indicated. FAP, familial adenomatous polyposis; LPL, lamina propria lymphocytes; Trm, resident memory T cells.

