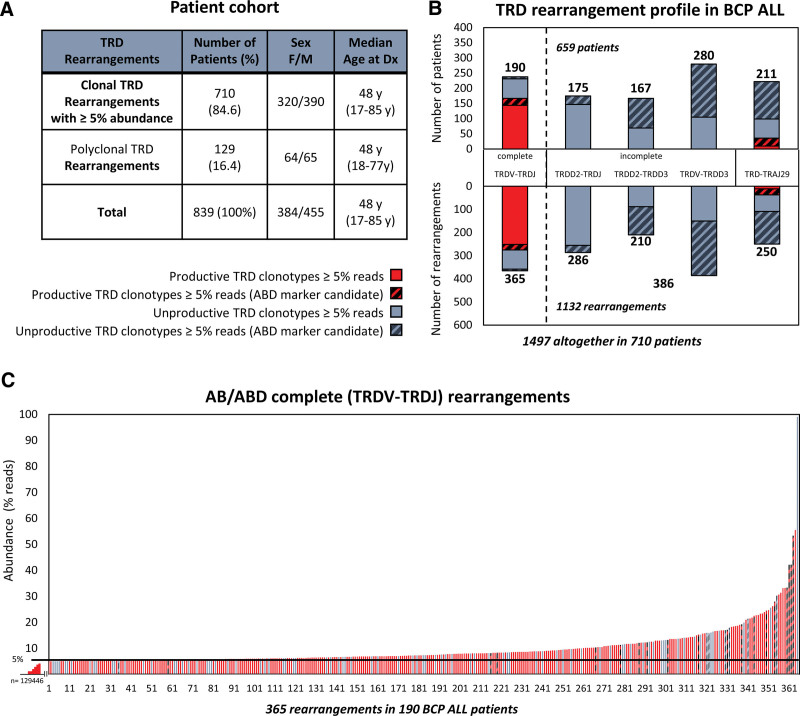
Figure 1.
TRD rearrangement profiles in a cohort of patients with BCP-ALL. (A) Description of a cohort of 839 BCP-ALL patients with or without clonal TRD (≥5% reads) rearrangements. (B) Patients (upper panel) and their clonal TRD rearrangements (lower panel) identified using AB (filled) and ABD (dashed) are grouped based on junction class and TRD rearrangement profile. ABD TRD rearrangements were defined among AB TRD rearrangements. (C) Abundances (in % reads, y-axis) of all 365 marker-candidate complete TRDV-TRDJ rearrangements (x-axis). Red and gray bars represent productive and unproductive TRDV-TRDJ rearrangements, respectively. TRD clonotype read counts were converted in to a TRD clonotype cell counts in 305 of 365 complete TRDV-TRDJ rearrangements (154/190 patients) (Suppl. Table S1). AB = abundance-based approach; ABD = abundance and distribution-based approach; BCP-ALL = B-cell precursor acute lymphoblastic leukemia; MRD = minimal or measurable residual disease; TRD = TR delta.

