
Fig. 11.
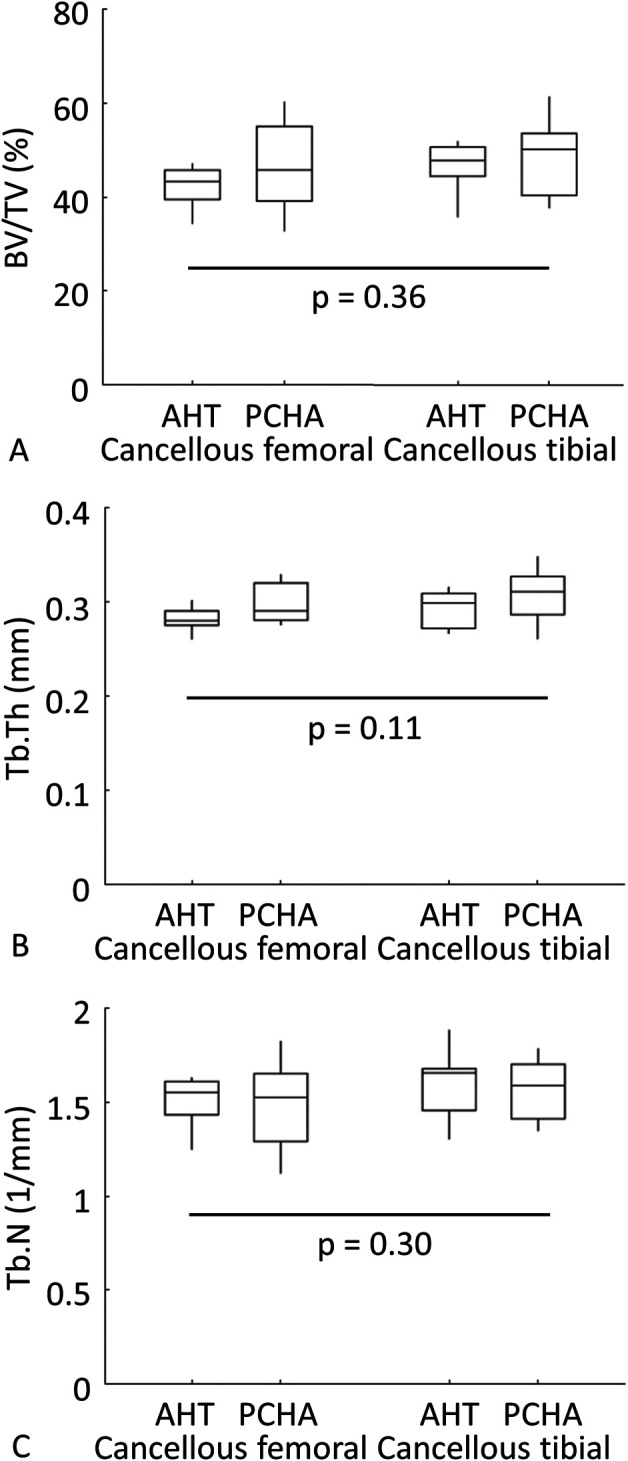
A-C Descriptive statistics for femoral and tibial (A) bone volume/tissue volume (BV/TV, %), (B) trabecular thickness (Tb.Th, mm), and (C) trabecular number (Tb.N, mm-1) for cancellous bone surrounding AHT and PCHA implants are shown. In the box and whisker plots, the box center line indicates the median value, box limits indicate the first (25th percentile) and third (75th percentile) quartiles, and the whiskers indicate the minimum and maximum values. The p values refer to the results of the corresponding linear mixed model.