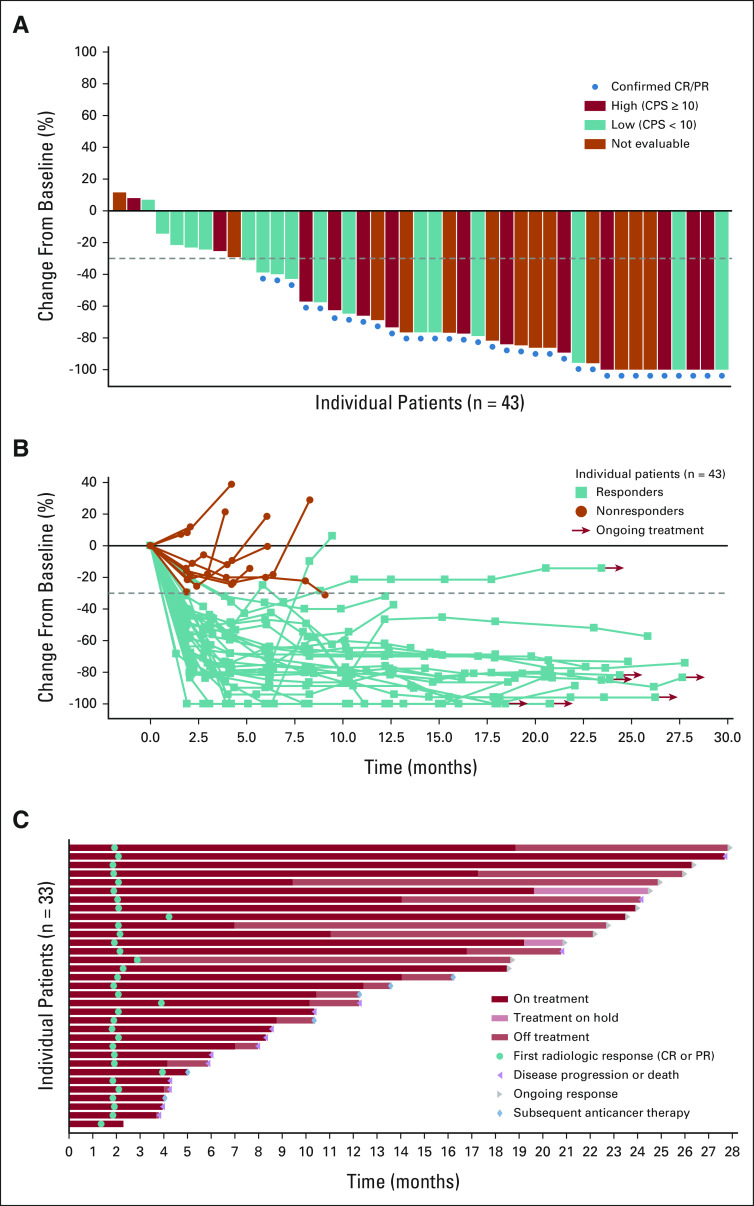
FIG 2.
Change in target lesions from baseline. (A) Waterfall plot of change from baseline in the sum of the diameters of target lesions by investigator per RECIST v1.1. (B) Change from baseline of the sum of diameters of target lesions (the dotted horizontal line indicates threshold for partial response (–30%) but is not necessarily indicative of response) and (C) Swimmer plot of time to response and duration of response in patients achieving confirmed objective response per RECIST v1.1. PD-L1 expression status was assessed using the combined positive score (low, < 10; high ≥ 10) with a validated PD-L1 IHC assay using the 22C3 antibody. Two patients did not have any post-baseline response assessments before the end of the study and did not have change from baseline in sum of the diameters of target lesions. CPS, combined positive score; CR, complete response; IHC, immunohistochemistry; PR, partial response.

