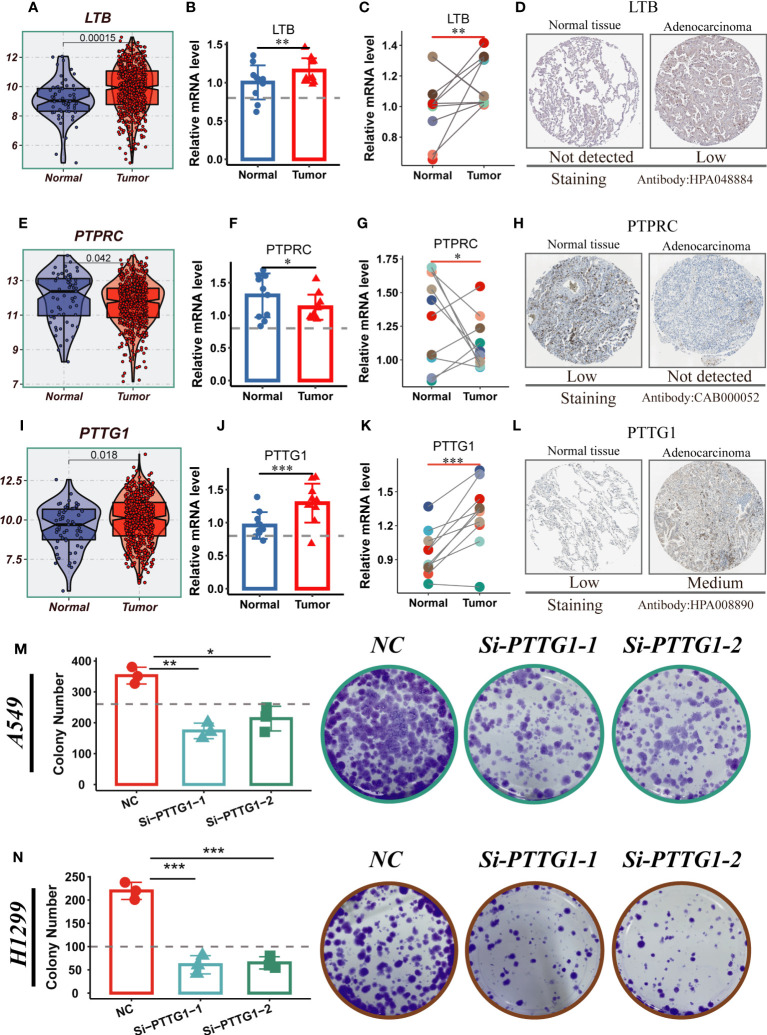
Figure 11.
Experimental validation of model gene. (A) Boxplots showing the differential expression of LTB between tumor and normal tissues in TCGA-LUAD. (B–D) Relative expression of LTB gene in 10 pairs of cancer and paracancer samples, respectively; the HPA database shows the expression of LTB gene in LUAD and normal tissues (E) Boxplots showing the differential expression of PTPRC between tumor and normal tissues in TCGA-LUAD. (F–H) Relative expression of PTPRC gene in 10 pairs of cancer and paraneoplastic samples, respectively; the HPA database shows the expression of PTPRC gene in LUAD and normal tissues. (I) Boxplots showing the differential expression of PTTG1 between tumor and normal tissues in TCGA-LUAD. (J–L) Relative expression of PTTG1 gene in 10 pairs of cancer and paraneoplastic samples, respectively; the HPA database shows the expression of PTTG1 gene in LUAD and normal tissues. (M, N) Cloning experiments showed that PTTG1 knockdown could significantly reduce the proliferation capacity of LUAD cells. Note: *P < 0.05, **P < 0.01, ***P < 0.001.

