
FIGURE 3.
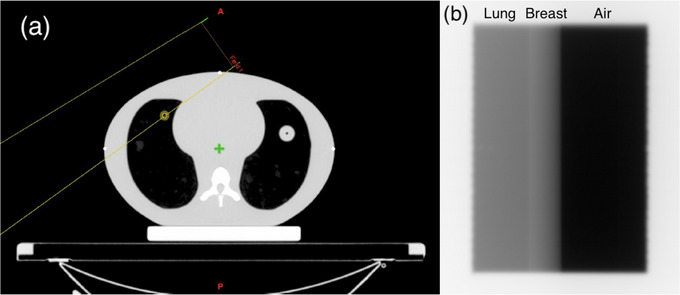
Dynamic thorax phantom. (a) Schematic diagram of dynamic thorax phantom, with the yellow outline showing radiation field boundaries. (b) Sample EPID image from thorax phantom with different tissue types labeled. The amount of exposed lung was varied by adjusting the MLC position in increments of 1, 2, 5, and 10 mm.