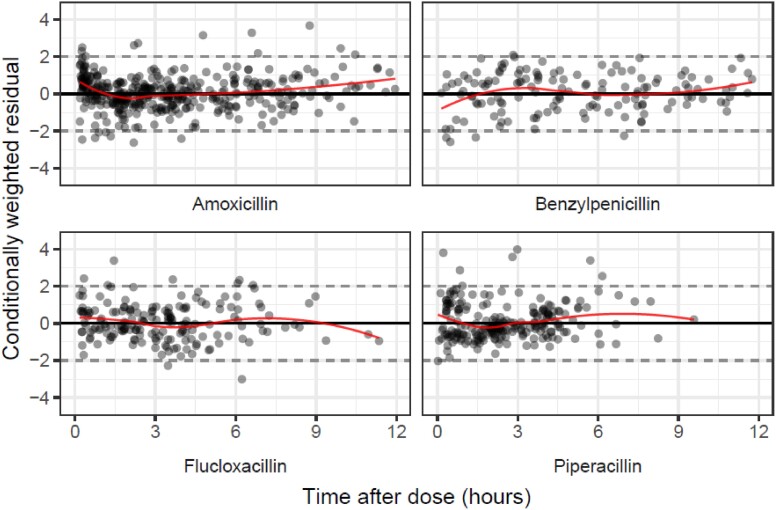
Figure 3.
GOF plots for combined IV model, stratified by drug: conditionally weighted residual errors plotted against time after dose (for 0–12 h following the IV dose) for amoxicillin, benzylpenicillin, flucloxacillin and piperacillin. Additional plot available in the Supplementary data. This figure appears in colour in the online version of JAC and in black and white in the print version of JAC.

