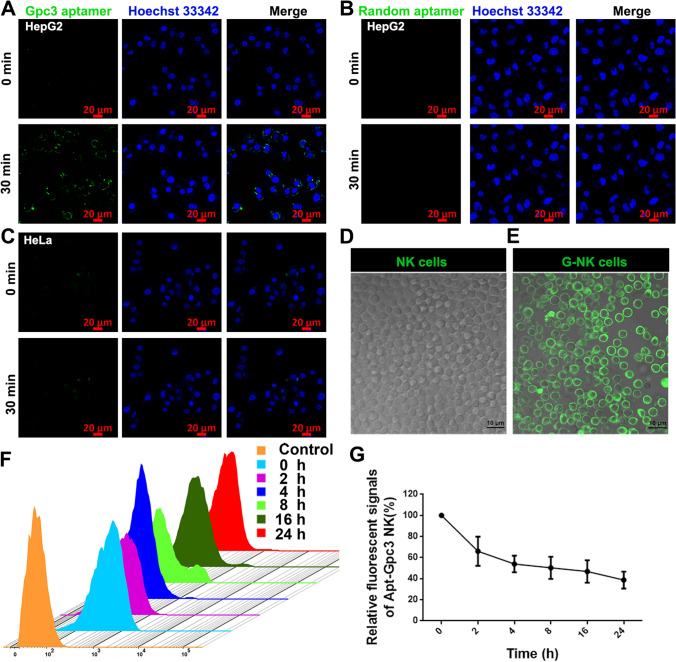
Fig. 1.
The characterization of Gpc3 aptamer and G-NK cells. A, B Confocal microscopy (CLSM) image of HepG2 cells after incubation with Gpc3 aptamerFAM (A) and random aptamer (B) for 30 min. Scale bar, 20 μm. C CLSM image of HeLa cells after incubation with Gpc3 aptamerFAM for 30 min. Scale bar, 20 μm. D, E. CLSM images of NK cells and GFAM-NK cells. Scale bar, 10 μm. F The dynamic stability of Gpc3 aptamerFAM labelled on NK cells. G The relative fluorescence intensity of FAM from GFAM-NK cells at different incubation times, n = 3. G-NK cells without in vitro culture were defined as 0 h group in F-G

