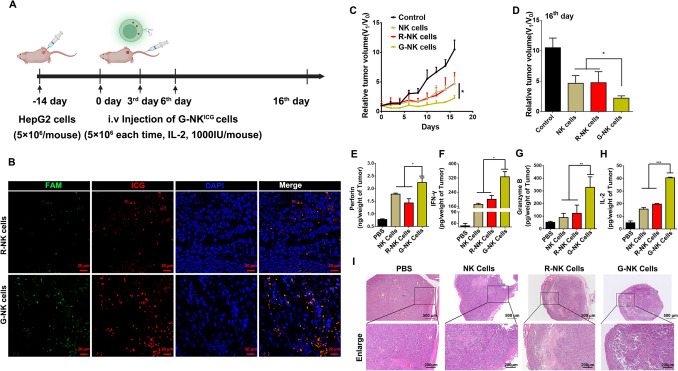
Fig. 4.
A Schematic illustration of the treatment protocol. B CLSM image of tumor slices after administration of R-NK cells or G-NK cells as indicated after 24 h. C The relative tumor volumes for mice treated as indicated. V1 is the final tumor volume and V0 is the initial tumor volume. Statistical analysis was performed with ANOVA (n = 4; *p < 0.05, **p < 0.01, *** p < 0.001). D Ex vivo tumors in each group at 16 day after receiving various treatments as indicated. Statistical analysis was performed with ANOVA (n = 4; *p < 0.05, **p < 0.01, *** p < 0.001). E–H Cytokine secretion from NK cells in tumors. Statistical analysis was performed with ANOVA (n = 3; *p < 0.05, **p < 0.01, *** p < 0.001). I H&E staining of tumors after receiving different treatments. Scale bar: 500 μm, 200 μm

