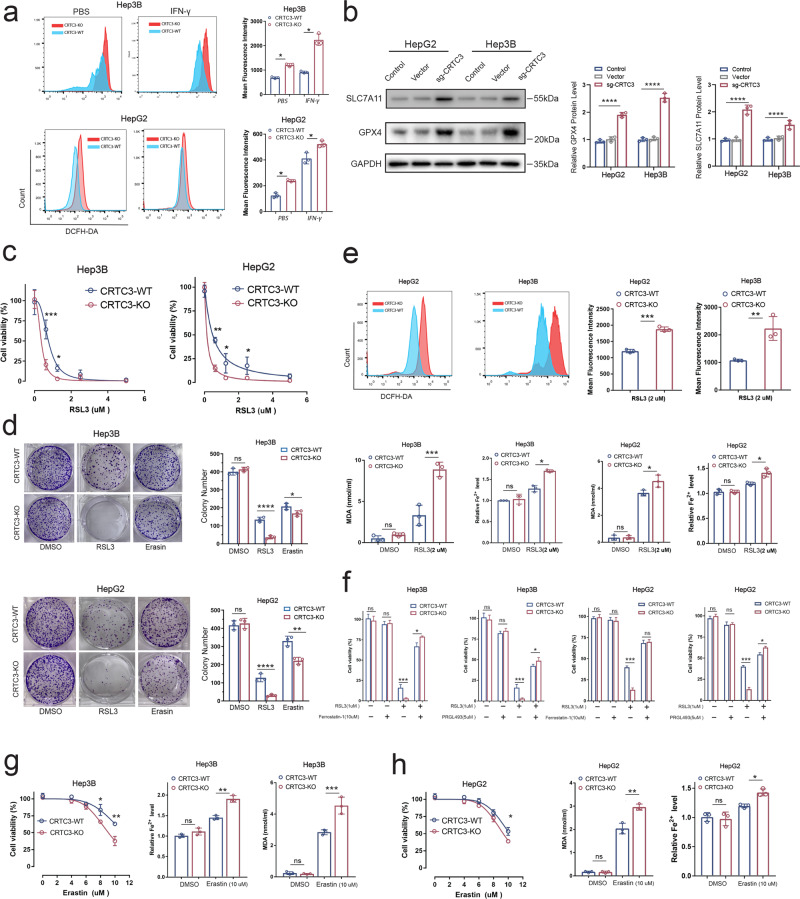
Fig. 4. CRTC3 depletion enhanced sensitivity to treatment by inducing ferroptosis.
a Flow cytometry analyses revealed higher baseline levels of ROS in Hep3B and HepG2 cells (n = 3), which were further increased by IFN-γ treatment (250 ng/mL). b Western blotting (replicated for three times) revealed increased expressions of SLC7A11 and GPx4 in both Hep3B and HepG2 cell lines following CRTC3 knockout. c CRTC3-KO and CRTC3-WT Hep3B and HepG2 cells were treated with various doses of RSL3, after which CCK-8 assays were used to assess short-term cell viability (n = 6). d Colony formation assays were used to assess long-term cell viability after treatment with RSL3 (500 nM; n = 3). e RSL3 (1 μM) treatment for 24 h markedly elevated MDA, iron and ROS levels in CRTC3-KO Hep3B and HepG2 cells, compared to control cells (n = 3). f CRTC3-KO and CRTC3-WT Hep3B and HepG2 cells were treated with RSL3 (1 μM) with or without a ferroptosis inhibitor (Ferrostatin-1 (10 μM)) and an ACSL4 inhibitor (PRGL493 (5 μM)). CCK-8 assays were used to assess the inhibition of cell proliferation (n = 6). g, h CRTC3 knockout sensitized HCC cells to erastin (n = 6), with amplified MDA and ion levels (n = 3). *P < 0.05; **P < 0.01; ***P < 0.001; Student’s t test.

