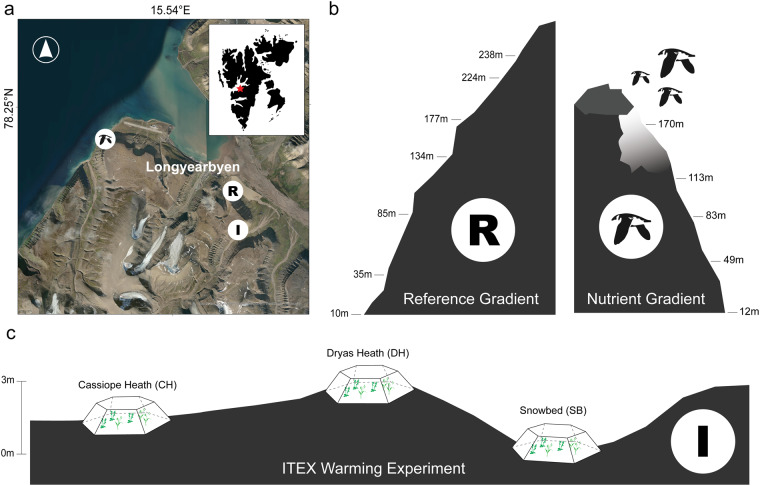
Fig. 1.
Experimental site and gradients for the traits and associated data sampling in High Arctic Svalbard. (a) Inset map and aerial photo showing the location of the study area on Svalbard and the location of the seabird nutrient input gradient (bird icon), reference gradient (R), and ITEX warming experiment (I) in relation to Longyearbyen. (b) Schematic illustration of the elevational distribution of sites (marked by their elevation) and nutrient influence (lighter area below the little auk colony) within the reference (R) and nutrient input (bird icon) gradient. (c) Schematic illustration of the relative topographic positions of the Dryas heath (DH), Cassiope heath (CH), and snowbed (SB) habitats, each represented by one Open Top Chamber, along a snowmelt gradient within the ITEX site (I), Note that the full ITEX site design includes five OTCs and five control plots (not shown) within each habitat.

