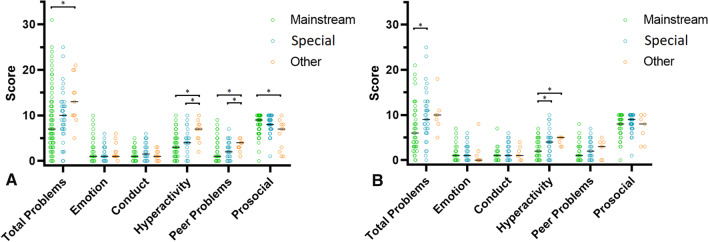
Fig. 5.
A HA users’ parent-reported SDQ scores by education. Distribution per SDQ scale is provided per education type for HA users. The mean value for each group is indicated by the black dashes. Higher scores indicate more problems, except for the prosocial behavior scale, in which higher scores indicate more favorable behavior. Significant differences are illustrated by an asterisk. B CI users’ parent-reported SDQ scores by education. The distribution per SDQ scale is provided per education type for CI users. The mean value for each group is indicated by the black dashes. Higher scores indicate more problems, except for the prosocial behavior scale, in which higher scores indicate more favorable behavior. Significant differences are illustrated by an asterisk

