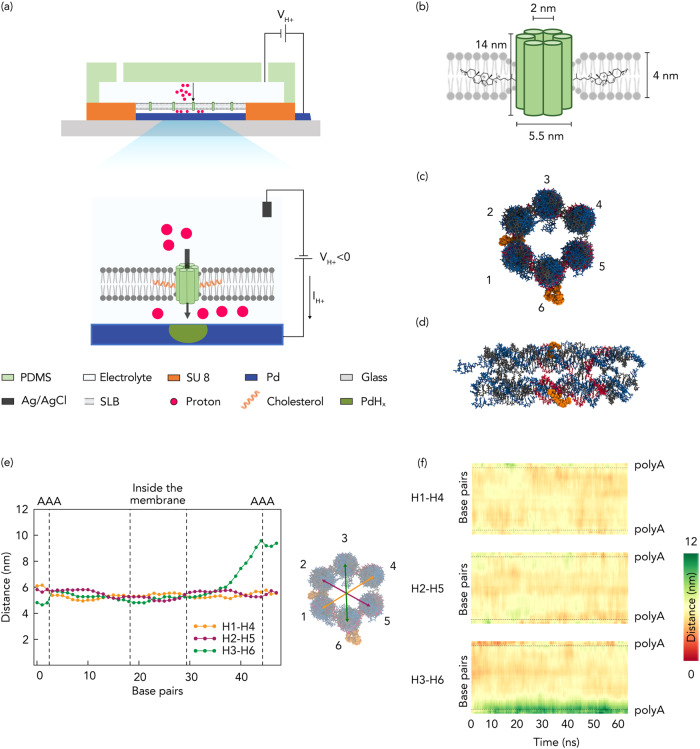
Fig. 1. Schematics of bioprotonic devices.
a Schematic depiction of the bioprotonic device. b Schematic representation of a DNA nanopore comprising six-helix bundles and 2-cholesterol anchors. c Top view of DNA nanopores with positioned cholesterol anchors. d Lateral view of DNA nanopores with positioned base pairs. e Simulation of the average distance between the diametrically opposite strands across the length of the nanopore. Yellow for distance between strands 1 and 4, green for distance between strands 2 and 5 and magenta for distance between strands 3 and 6. f Average distance heatmap for the pairs indicated in (c) and (e).

