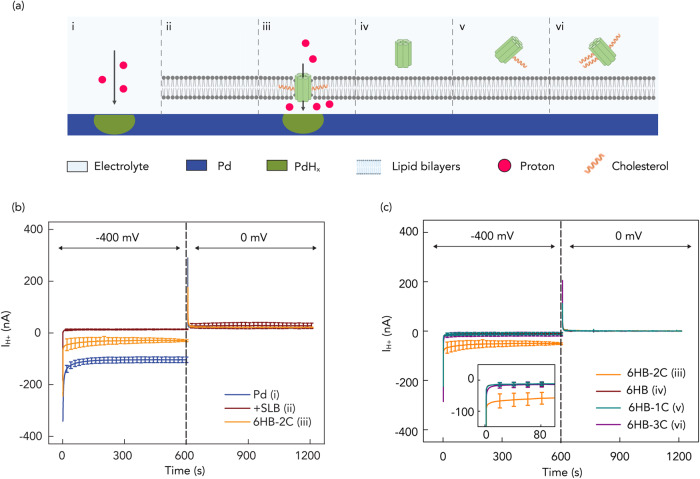
Fig. 2. Schematics of control of H+ by membrane spanning DNA nanopores.
a i) Pd contact with electrolyte solution; ii) Pd contact coated with SLBs; iii) DNA nanopores with 2-cholesterol anchors (6HB-2C); iv) DNA nanopores without cholesterol anchor (6HB); v) DNA nanopores with 1-cholesterol anchor (6HB-1C); vi) DNA nanopores with 3-cholesterol anchors (6HB-3C). b IH+ versus time plot for V = −400 mV and V = 0 mV. Blue trace Pd, red trace SLB, Orange trace 6HB-2C. At V = −400 mV, the IH+ = −125 ± 11 nA with bare Pd decreased to −7 ± 1 nA with SLBs that indicates formed bilayers inhibit H+ transfer from the bulk solution to the Pd/solution interface. The IH+ = −52 ± 4 nA with 6HB-2C confirmed that the nanopore channels support the H+ transport. Error bars are 1 s.d. (n = 3). c IH+ versus time plot in different situations of Fig.2a under V = −400 mV and V = 0 mV. Orange trace 6HB-2C (2a-iii), red trace 6HB (2a-iv), cyan trace 6HB-1C (2a-v), and purple trace 6HB-3C (2a-vi). Under −400 mV, we also measured IH+ = −11 ± 5 nA, −13 ± 7 nA, and −12 ± 4 nA with 6HB, 6HB-1C and 6HB-3C, respectively. Error bars are 1 s.d. (n = 3). Only 6HB-2C provides created pathway to facilitate the flow of H+ to the Pd/solution interface. For all measurements, we switched the voltage to 0 mV, roughly after 600 s from the first instance of measurement, the H absorbed in Pd is oxidized to H+ and released back into the solution, allowing the current measured to return to 0 nA.

