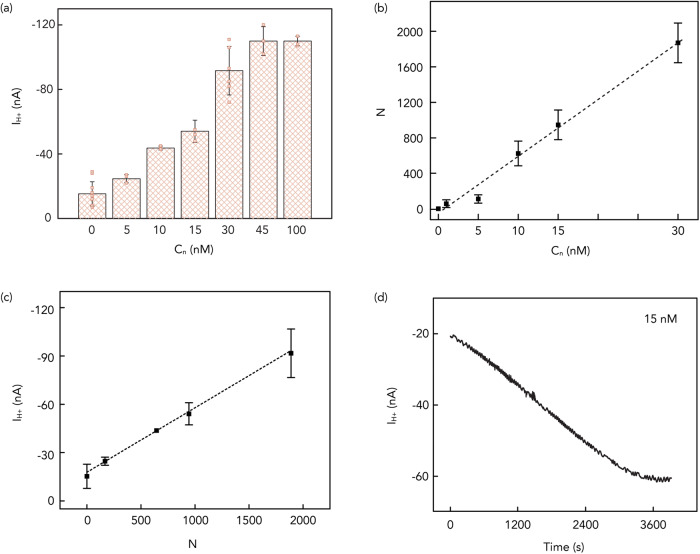
Fig. 4. Illustration of DNA nanopores characteristics.
a IH+ versus the introduced 6HB-2C concentration (Cn) plot (VH+ = −400 mV) for 6HB-2C nanopores. We measured IH+ = −15 ± 8 nA, −25 ± 3 nA, −44 ± 1 nA, −52 ± 4 nA, −92 ± 15 nA, −111 ± 9 nA and−110 ± 3 nA with 0 nM, 5 nM, 10 nM, 15 nM, 30 nM, 45 nM and 100 nM of 6HB-2C, respectively. Error bars are 1 s.d. (n = 10, 3, 3, 3, 6, 3 and 3 for 0 nM, 5 nM, 10 nM, 15 nM, 30 nM, 45 nM and 100 nM respectively). b The number of inserted 6HB-2C nanopores (N) versus the introduced 6HB-2C concentration (Cn) plot. The value of the slope in the plot is 64. Error bars are 1 s.d. (n = 3). c IH+ versus Number of inserted 6HB-2C nanopores (N) under −400 mV. The value of the slope in the plot is 4 × 10-11. Error bars are 1 s.d. (n = 3). d IH+ versus time plot during 15 nM 6HB-2C insertion process under −400 mV.

