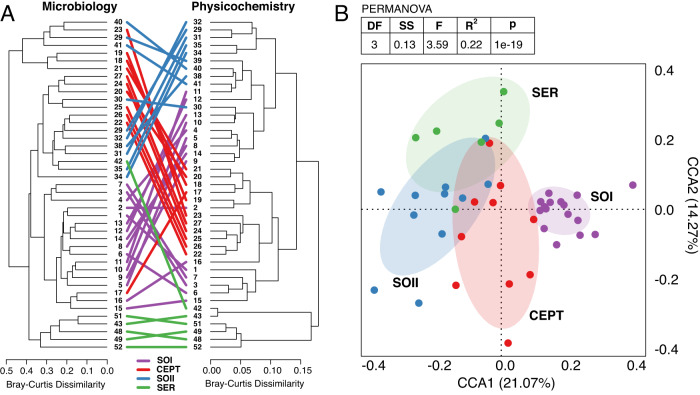
Fig. 3. Relationships between microbial community structure and physicochemical conditions.
A The structures of the AD microbial community (ASV data) and the AD physicochemical data are expressed as Bray-Curtis dissimilarity plotted in a dendrogram. Identical samples in each data-type dendrogram are connected with a line and colored corresponding to their process configuration. B The combined table of ASV and physicochemical data underwent principal coordinate analysis and samples were plotted in the first two coordinate dimensions. The variance explained by each dimension is shown as a percent in the axis text. Samples are colored by their process configuration and ellipses sized by the 95% confidence of the centroid of each configuration group are laid in the background. The two-sided PERMANOVA table above the plot shows results of a test between the four configuration groups.

