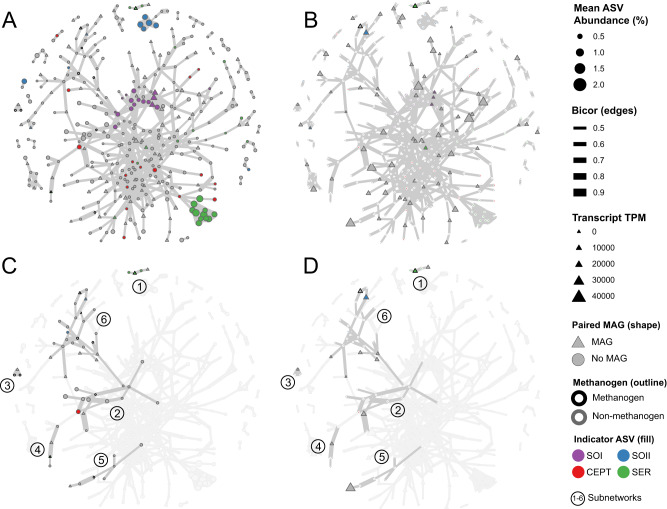
Fig. 4. A weighted co-occurrence network of the microbial community depicting multiple-test-corrected biweight midcorrelation values (edges) of ASVs (nodes) across the two-year time series.
Panels (A) and (C) depict the network wherein node sizes represent ASV mean relative abundance across all samples, while Panels (B) and (D) depict node sizes which represent transcript expression levels (TPM) of the representative node MAG. Nodes are shaded with color if they are indicator ASVs for a given process configuration, outlined in black if they are methanogen ASVs, and shaped as triangles if they have a representative MAG. Subnetworks are numbered and highlighted in Panels (C) and (D).

