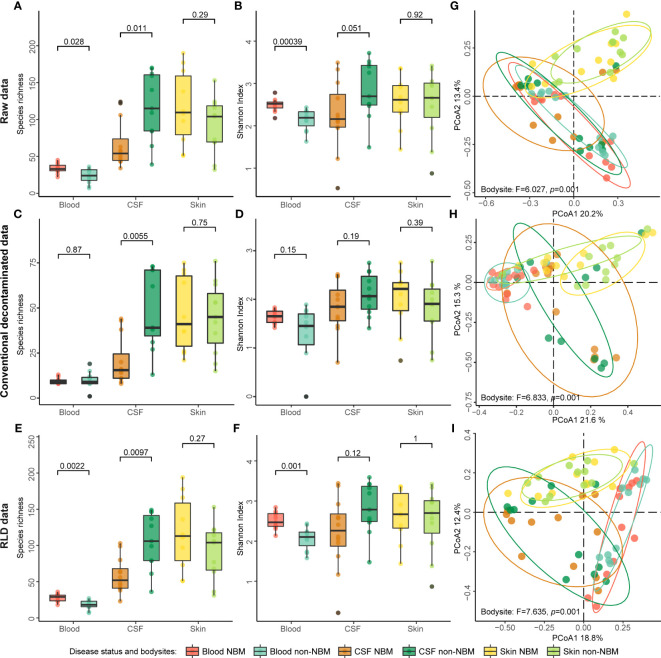
Figure 2.
Alpha and beta diversity of the raw and decontaminated 2bRAD sequencing data. (A–F) Species richness and Shannon index of the raw data and decontaminated data were calculated separately to evaluate the alpha diversity of NBM and non-NBM individuals from different body sites (blood, CSF, and skin). (G–I) Beta diversity was implemented using the Bray-Curtis distance-based PCoA. Both species richness and Shannon index showed that this method of contamination removal did not significantly impact the comparisons of the alpha diversity of NBM and non-NBM individuals (p > 0.05).

