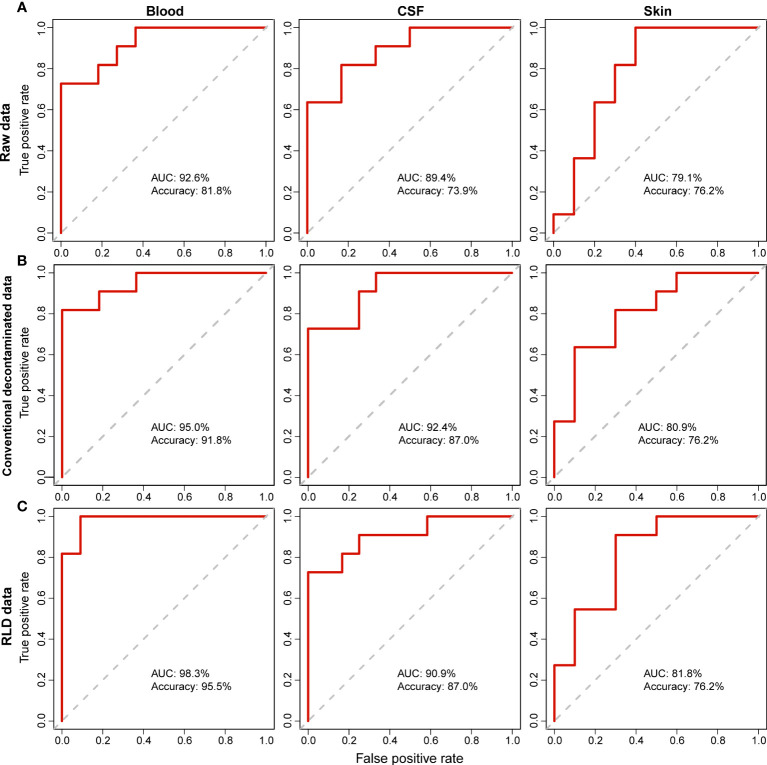
Figure 3.
Comparison of the Random Forest (RF) models using the raw and decontaminated data in determining NBM. For both (A) raw data (B) decontamination data by conventional method, and (C) decontamination data by RLD, RF prediction models were built using the relative abundance of taxa identified in different body sites (blood, CSF and skin) to diagnose the infection (NBM). The robustness of the RF models was evaluated by the Area Under the Receiver Operating Characteristic Curve (AUC).

