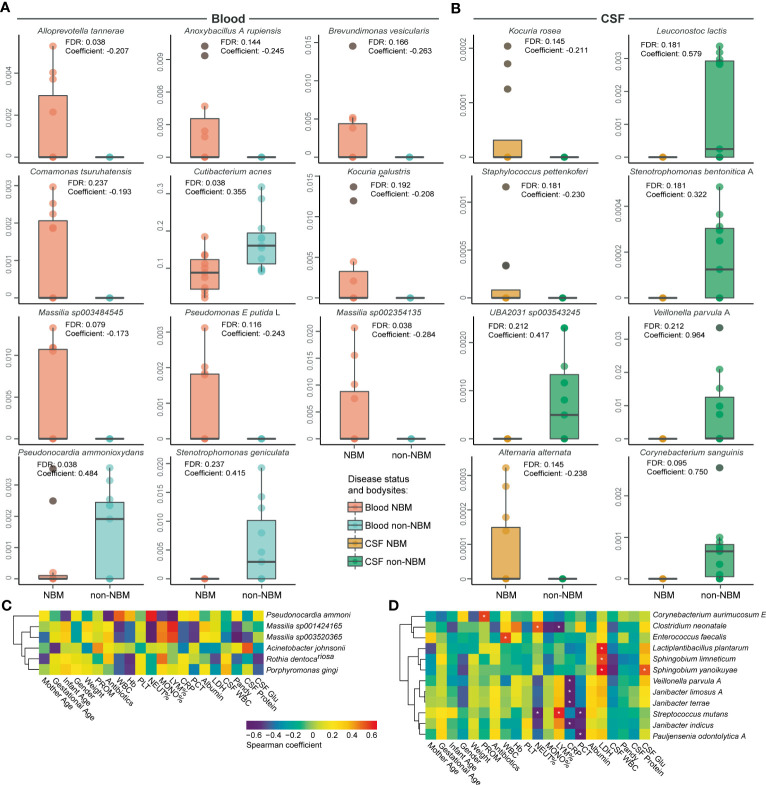
Figure 4.
Differential and associated species in NBM. Boxplots of the differentially abundant species between the NBM and non-NBM groups in (A) blood and (B) CSF samples, no significant difference between the two groups were found in skin samples. (C, D) Correlations between differential species and physiological indicators in (C) blood and (D) CSF samples (defined by a Spearman coefficient of p< 0.05, and |r| > 0.6). FDR<0.2 were marked with an asterisk.

