. 2023 Jun 9;22(9):999–1012. doi: 10.1158/1535-7163.MCT-22-0786

Figure 1.

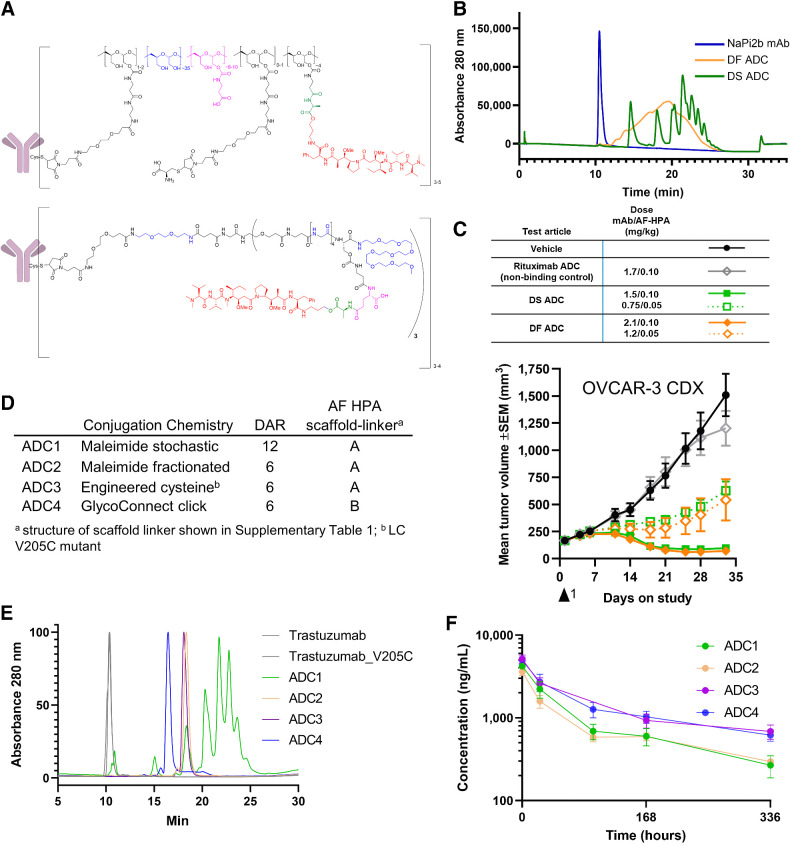
Figure 1. Development of DS and site-specific technology. A, DS ADCs (bottom structure) incorporate structural elements of the DF platform (top structure) within a fully synthetic, well-defined scaffold with a specific number of drugs per conjugated unit. B, The HIC of DS ADC indicates enhanced homogeneity over the DF ADC; C, Antitumor activity of DS and DF ADC following a single dose is comparable at equivalent drug dose and 2 dose levels; D, Trastuzumab ADCs made by four distinct approaches and two scaffold-linker payloads to generate DAR12 and DAR6 conjugates; E, HIC HPLC of trastuzumab ADCs; ADC3 and ADC4 show a fully homogeneous profile; F, Pharmacokinetics profile of ADC1–4 following a single intravenous bolus administration of ADC equivalent to a 0.199 mg/kg AF HPA dose to female CB.17 SCID mice bearing JIMT-1 human breast carcinoma xenograft tumors (6 mice per group) and samples collected at 10 min, 24 hours, 96 hours (ADC3 did not have the 96 hours timepoint due to operator error), 168 hours, and 336 hours. Graph depicts conjugated drug analyte concentration over the course of the study.

Development of DS and site-specific technology. A, DS ADCs (bottom structure) incorporate structural elements of the DF platform (top structure) within a fully synthetic, well-defined scaffold with a specific number of drugs per conjugated unit. B, The HIC of DS ADC indicates enhanced homogeneity over the DF ADC; C, Antitumor activity of DS and DF ADC following a single dose is comparable at equivalent drug dose and 2 dose levels; D, Trastuzumab ADCs made by four distinct approaches and two scaffold-linker payloads to generate DAR12 and DAR6 conjugates; E, HIC HPLC of trastuzumab ADCs; ADC3 and ADC4 show a fully homogeneous profile; F, Pharmacokinetics profile of ADC1–4 following a single intravenous bolus administration of ADC equivalent to a 0.199 mg/kg AF HPA dose to female CB.17 SCID mice bearing JIMT-1 human breast carcinoma xenograft tumors (6 mice per group) and samples collected at 10 min, 24 hours, 96 hours (ADC3 did not have the 96 hours timepoint due to operator error), 168 hours, and 336 hours. Graph depicts conjugated drug analyte concentration over the course of the study.