. 2023 Jun 9;22(9):999–1012. doi: 10.1158/1535-7163.MCT-22-0786

Figure 5.

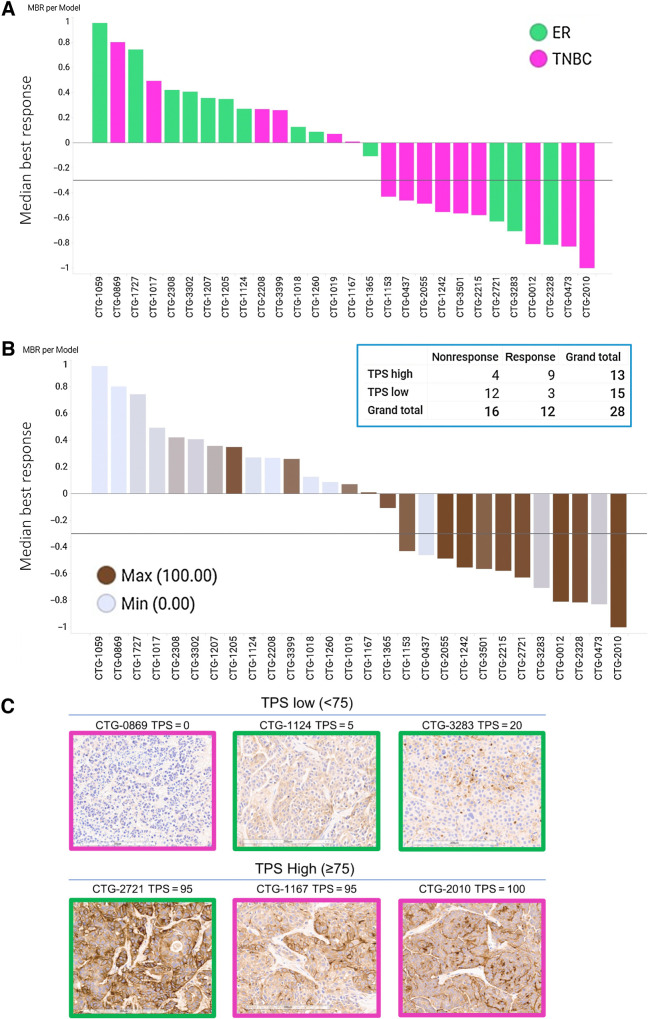
Figure 5. XMT-1660 activity across a panel of breast cancer PDX. A, Waterfall plot of MBR among n = 3 per PDX model. Pink bars, TNBC. Green bars, ER+ breast cancer. B, The data from part A shown with B7-H4 IHC score in each model. Inset, responsive (MBR ≤ −0.3) and nonresponsive tumors when categorized by B7-H4 IHC as low TPS (< 75) or high TPS (≥75). C, Representative B7-H4 IHC images from pink (TNBC) and green (ER+) PDX models with low TPS (<75) and high TPS (≥75).

XMT-1660 activity across a panel of breast cancer PDX. A, Waterfall plot of MBR among n = 3 per PDX model. Pink bars, TNBC. Green bars, ER+ breast cancer. B, The data from part A shown with B7-H4 IHC score in each model. Inset, responsive (MBR ≤ −0.3) and nonresponsive tumors when categorized by B7-H4 IHC as low TPS (< 75) or high TPS (≥75). C, Representative B7-H4 IHC images from pink (TNBC) and green (ER+) PDX models with low TPS (<75) and high TPS (≥75).