Figure 2.

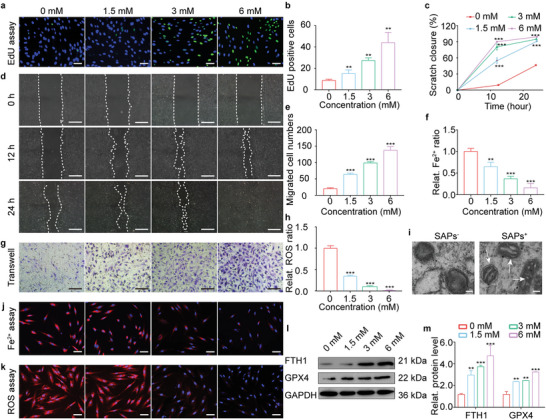
SAPs restored cellular functions of HG‐HDFs by inhibiting their ferroptosis. a,b) EdU immunofluorescence images (a) and corresponding statistical analysis (b) indicating the proliferation behavior of HG‐HDFs treated by SAPs with different concentrations (0, 1.5, 3, and 6 mm) (n = 3 per group). Blue and green fluorescence represent Hoechst‐33342 staining and EdU staining, respectively. c) and d) Representative migrating images (d) and quantitative statistics (c) showing scratch closure ratio of HG‐HDFs co‐cultured with SAPs (0, 1.5, 3, and 6 mm) demonstrated by scratch assay. White dotted lines indicated the boundary of migration (n = 3 per group). e,g) Representative images (g) and matching statistical analysis (e) showing the migrated cell numbers of HG‐HDFs co‐cultured with SAPs reflected by transwell assay. The migrated HG‐HDFs in the back of the upper chamber of the transwell system were dyed with crystal violet (n = 3 per group). f,j) Representative fluorescent images (j) and quantitative analysis (f) of intracellular Fe2+ accumulation in HG‐HDFs exposed to SAPs with varying concentrations after 24 h (n = 3 per group). Intracellular Fe2+ and cell nuclei were dyed with red and blue fluorescence, respectively. h,k) Representative fluorescent images (k) and quantitative analysis (h) showing intracellular ROS level of HG‐HDFs after incubating with SAPs for 24 h (n = 3 per group). Intracellular ROS and cell nuclei were dyed with red and blue fluorescence, respectively. i) TEM images showing mitochondrial ultrastructure (represented by white arrows) in HG‐HDFs with or without the treatment of SAPs. l,m) Representative Western blotting images (l) and quantitative band intensities (m) detecting protein expression level of FTH1 and GPX4 in HG‐HDFs stimulated with SAPs after 24 h (n = 3 per group, all proteins levels are normalized to loading control, GAPDH). Data represent mean ± SD. Statistical significance was calculated by one‐way ANOVA with Tukey's significant difference multiple comparisons for (b), (c), (e), (f), (h), and (m). Significant differences between 0 mM group with other groups are indicated as **p < 0.01, ***p < 0.001. Scale bar, 50 µm for (a), (j) and (k), 100 µm for (d) and (g).
