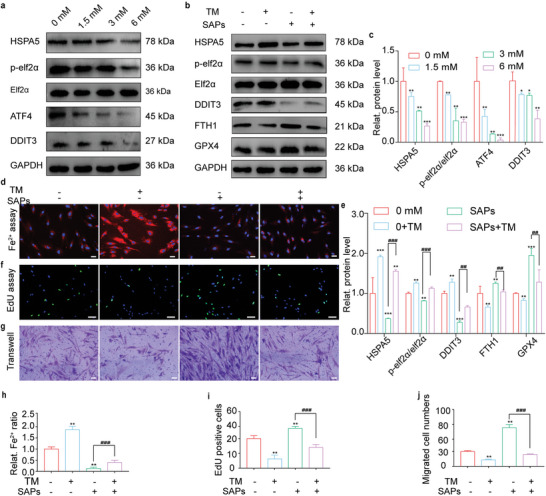
Figure 3.

SAPs inhibited ferroptosis by decreasing ER stress‐regulated generation of free Fe2+ in HG‐HDFs. a,c) Representative Western blotting images (a) and quantitative band intensities (c) indicating the expression level of ER stress‐associated proteins (HSPA5, p‐elf2α/elf2α, ATF4, and DDIT3) in HG‐HDFs co‐incubated with SAPs (0, 1.5, 3 and 6 mm) (n = 3 per group, all proteins levels are normalized to loading control, GAPDH). b) and e) Representative Western blotting images (b) and quantitative band intensities (e) showing the expression of ER stress‐related proteins (HSPA5, p‐elf2α/elf2α, DDIT3), and ferroptosis‐associated proteins (FTH1 and GPX4) in HG‐HDFs with or without the treatments of SAPs and TM (the activator of ER stress) (n = 3 per group, all proteins levels are normalized to loading control, GAPDH). d,h) Representative fluorescent images (d) and quantitative analysis (h) of intracellular Fe2+ level in HG‐HDFs treated with or without SAPs and TM (n = 3 per group). f,i) Representative EdU immunofluorescence images (f) and corresponding quantitative analysis (i) of HG‐HDFs treated with or without SAPs and TM (n = 3 per group). g,j) Representative images (g) and statistical analysis (j) showing the migrated cell numbers of HG‐HDFs with or without the existence of SAPs and TM reflected by transwell assay (n = 3 per group). Results are representative of at least three independent experiments. Data represent mean ± SD. Statistical significance was calculated by one‐way ANOVA with Tukey's significant difference multiple comparisons for (c), (e), (h), (i), and (j). Significant differences between TM−+SAPs− group with other groups are indicated as * p < 0.05, **p < 0.01, ***p < 0.001. Significant differences between TM−SAPs+ group and other groups are indicated as ## p < 0.01, p < 0.001. Scale bar, 50 µm for (d) and (f), 100 µm for (g).
