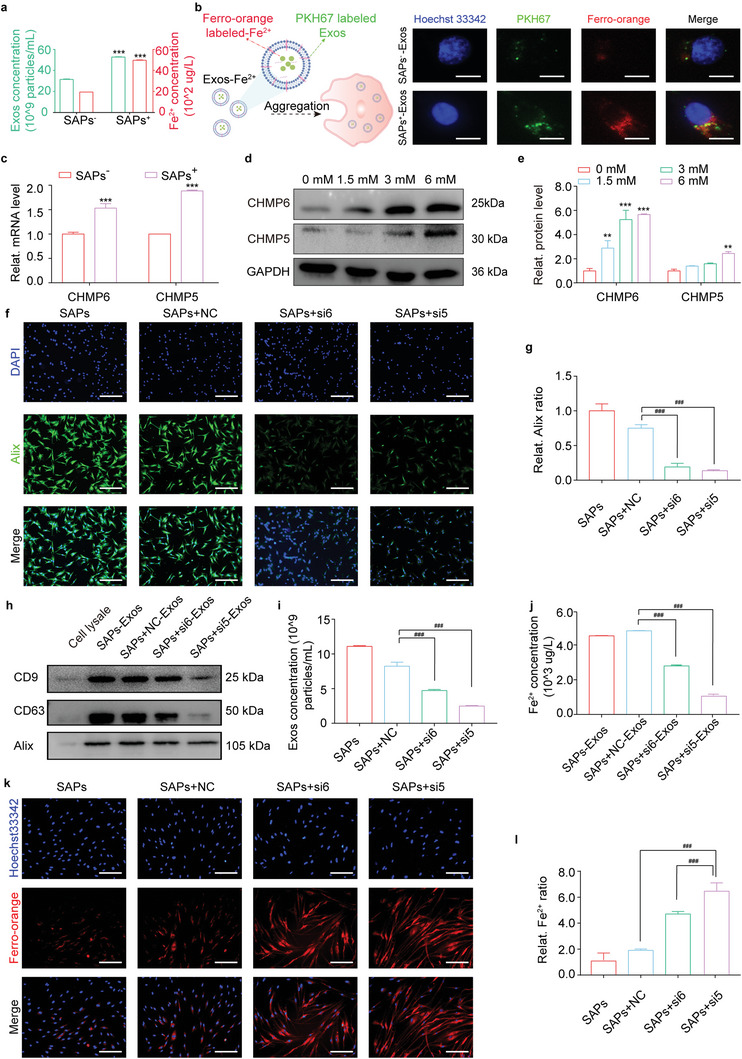
Figure 4.

SAPs inhibited ferroptosis by accelerating Exos’ release for discharging free Fe2+ from HG‐HDFs. a) Quantitative statistics demonstrating the concentrations of Exos and Fe2+ in the Exos derived from HG‐HDFs stimulated with or without SAPs (n = 3 per group). b) Schematic diagram and fluorescent images indicating the internalization of Exos containing Fe2+ (derived from HG‐HDFs stimulated with or without SAPs) by HUVECs for 2 h. Exos were co‐stained with green PKH67 and red ferro‐orange (n = 3 per group). c) qRT‐PCR analysis indicating the gene expression level of CHMP6 and CHMP5 in HG‐HDFs with or without SAPs (n = 3 per group, all mRNA levels are normalized to loading control, GAPDH). d,e) Western blotting analysis (d) and corresponding quantitative band intensities (e) displaying the protein expression level of CHMP6 and CHMP5 in HG‐HDFs cultured with SAPs (n = 3 per group, all proteins levels are normalized to loading control, GAPDH). f,g) Corresponding fluorescent images (f) and quantitative analysis (g) showing Alix positive HG‐HDFs treated with different groups (SAPs, SAPs+NC, SAPs+si6, SAPs+si5) (n = 3 per group). h) Representative Western blotting images showing the expression of biomarkers (CD9, CD63, Alix) on Exos secreted by HG‐HDFs treated with different groups (n = 3 per group). i) Quantitative statistics of the concentration of Exos derived from HG‐HDFs treated with different groups demonstrated by NTA analysis (n = 3 per group). j) Quantitative analysis of Fe2+ concentration inside Exos of HG‐HDFs treated with different groups measured by ICP‐MS (n = 3 per group). k,l) Representing fluorescent images (k) and quantitative analysis (l) indicating intracellular Fe2+ concentration in HG‐HDFs treated with different groups (n = 3 per group). Data represent mean ± SD. Statistical significance was calculated by Students t‐test with Welchs correction for (a) and (c), or one‐way ANOVA with Tukey's significant difference multiple comparisons for (e), (g), (i), (j), and (l). Significant differences between SAPs− or 0 mm groups with other groups are indicated as **p < 0.01, *** p < 0.001. Significant differences between SAPs+NC group and other groups are indicated as p < 0.001. Scale bar,50 µm for (b), 100 µm for (f) and (k).
