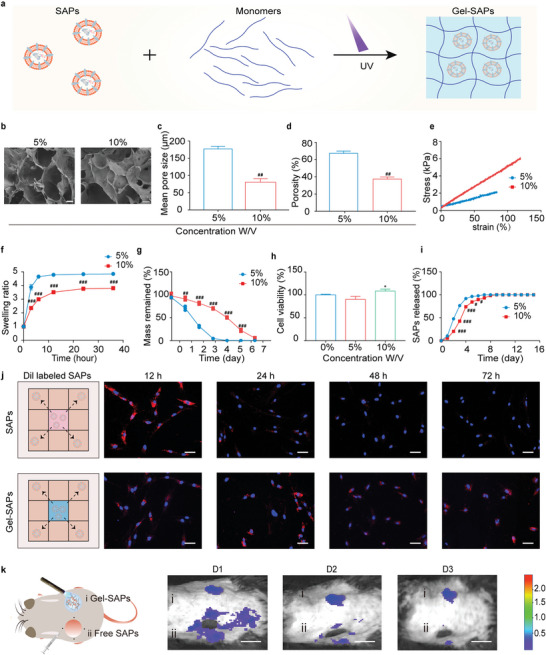
Figure 5.

Characterization of a functional wound dressing composed of porous GelMA hydrogel containing SAPs. a) Illustration displaying the prepared process of Gel‐SAPs. b) SEM images showing the porous structure of 5%‐Gel and 10%‐Gel (n = 3 per group). c,d) Quantitative statistics of pore size (c) and porosity (d) from SEM images in (b) (n = 3 per group). e,f) Stress‐strain curve (e) and swelling behavior (f) of 5%‐Gel and 10%‐Gel (n = 3 per group). g) Degradation ratio of 5%‐Gel and 10%‐Gel in vitro by immersing them in 1 mL DPBS containing 0.02 U ML−1 collagenase type II (n = 3 per group). h) Biocompatibility of 0%, 5% and 10%‐Gel reflected by CCK‐8 assay (n = 5 per groups). i) Released curve of SAPs from 5%‐Gel and 10%‐Gel (n = 3 per group). j) Illustration and fluorescent images of HG‐HDFs co‐cultured with free SAPs or Gel‐SAPs. SAPs were labeled red fluorescence by Dil and cell nuclei were labeled blue fluorescence by hoechst‐33342 (n = 3 per group). k) Illustration and representative images reflecting retention time of Dil labeled free SAPs (four‐point injection) or Gel‐SAPs in wound area at days 1, 2, and 3 (n = 6 per group). Results are representative of at least three independent experiments. Data represent mean ± SD. Statistical significance was calculated by Student's t‐test with Welch's correction for (c‐g, and i), or one‐way ANOVA with Tukey's significant difference multiple comparisons for (h). Significant differences between 0% groups and other group are indicated as *p < 0.05. Significant differences between 5%‐Gel group and other groups are indicated as # p < 0.05, ## p < 0.01, ### p < 0.001. Scale bar, 10 µm for (b), 50 µm for (j), 100 µm for (k).
