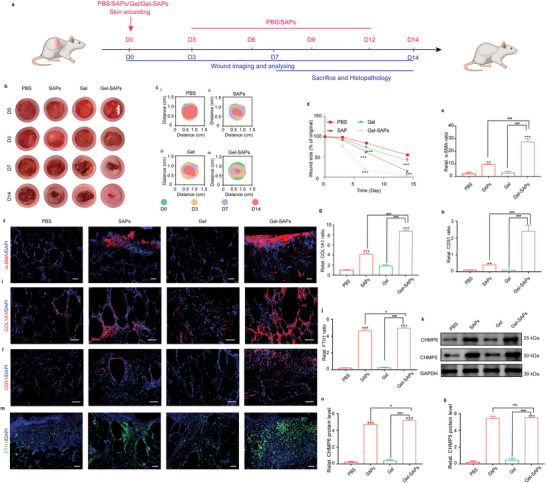
Figure 6.

Gel‐SAPs promoted diabetic wound healing in vivo by inhibiting the ferroptosis of skin repair cells. a) Timeline of wound treatment process. b–d) Representative images (b) closure traces (c) and quantitative analysis (d) of wound closure at days 0, 3, 7, and 14 treated with PBS, SAPs, Gel, and Gel‐SAPs (n = 6 per group). e,f) Immunofluorescence staining images (f) and quantification of α‐SMA (e) (red fluorescence) at wound sites with the treatment of PBS, SAPs, Gel, and Gel‐SAPs for day 7 (n = 6 per group). g,i) Immunofluorescence staining images (i) and quantification of COL1A1 (g) (red fluorescence) at wound sites with the treatment of PBS, SAPs, Gel, and Gel‐SAPs for day 7 (n = 6 per group). h,l) Immunofluorescence staining images (l) and quantification of CD31 (h) (red fluorescence) at wound sites with the treatment of PBS, SAPs, Gel, and Gel‐SAPs for day 7 (n = 6 per group). j,m) Representative fluorescent images (m) and quantitative analysis (j) of FTH1 level in PBS, SAPs, Gel, and Gel‐SAPs groups for day 7. (n = 6 per group). k,n,o) Representative Western blotting images (k) and quantitative band intensities (n,o) indicating the expression level of CHMP6 and CHMP5 in PBS, SAPs, Gel, and Gel‐SAPs groups. (n = 6 per group, all proteins levels are normalized to loading control, GAPDH). The cell nuclei were dyed blue fluorescence with 4',6‐diamidino‐2‐phenylindole (DAPI) for (f), (i), (l), and (m). Results are representative of at least three independent experiments. Data represent mean ± SD. Statistical significance was calculated by one‐way ANOVA with Tukey's significant difference multiple comparisons for (d), (e), (g), (h), (j), (n), and (o). Significant differences between PBS groups and other group are indicated as ***p < 0.001. Significant differences between Gel‐SAPs group and other groups are indicated as # p < 0.05, p < 0.001 compared with other groups. NS, not significant. Scale bar, 100 µm for (f) and (m), 50 µm for (i) and (l).
